BULLISH UPSIDE
TASUKI GAP
| Type: | Continuation |
| Relevance: | Bullish |
| Prior Trend: | Bullish |
| Reliability: | Medium |
| Confirmation: | Recommended |
| No. of Sticks: | 3 |
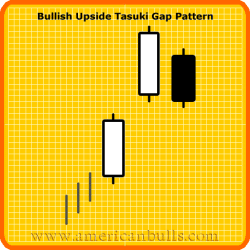
The pattern is characterized by two long white candlesticks with a gap upward between them during an uptrend. However the pattern also shows a black candlestick on the third day partially closing the gap between the first two. The black candlestick is the result of temporary profit taking. We expect the trend to continue upward following the direction of the upward gap.
Recognition Criteria:
1. Market is characterized by uptrend.2. We see two long white candlesticks with a gap between them.
3. Then we see black candlestick on the third day that opens within the body of the second day.
4. The third day candlestick closes into the gap but does not fully close the gap.
Explanation:
The Bullish Upside Tasuki Gap Pattern appears in a strongly upward market. This bullish move continues one more day with a gap in the direction of the uptrend. The black candlestick of the third day is characterized by an opening well into the body of the second day, which partially fills the gap. This third day, called the correction day, do not completely fill the gap so the previous uptrend should continue. This is a case of temporary profit taking. Since the gap is not filled or closed, the previous upward trend must continue.
Important Factors:
This Bullish Upside Tasuki Gap Pattern is a rare formation.
The real bodies of the last two candlesticks in the Bullish Upside Tasuki Gap Pattern are about the same size.
This Bullish Upside Tasuki Gap Pattern is a simple pattern quite similar to the Bullish Upside Gap Three Methods Pattern. The only difference is that in the Bullish Upside Gap Three Methods Pattern, the gap that is made between the first two days is filled in the third day.
A confirmation on the fourth day is recommended in the form of a white candlestick, a large gap up or a higher close.