BULLISH MAT
HOLD
| Type: | Continuation |
| Relevance: | Bullish |
| Prior Trend: | Bullish |
| Reliability: | High |
| Confirmation: | Suggested |
| No. of Sticks: | 5 |
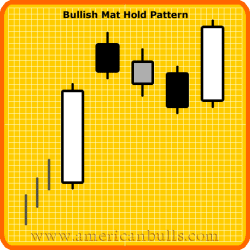
The Bullish Mat Hold Pattern is known as a strong continuation pattern. In this pattern, a long white candlestick appears during an uptrend, which then is followed by three consecutive small real bodies that constitute a short downtrend. Then bull ascendancy begins on the fifth day marked with a closing price that is a new high.
Recognition Criteria:
1. Market is characterized by uptrend.
2. We see a long white candlestick in the first day.
3. We then see an upward gap and a black candlestick on the second day.
4. We see a sequence of small real bodies constituting a brief downtrend
however staying within the range of the first day on the second, third,
and fourth days.
5. Finally we see a white candlestick, which opens with a gap and closes
with a new high on the fifth day.
Explanation:
The pattern appears during an uptrend, which is further confirmed by the first long white candlestick. Prices open with a gap next day and they trade within a narrow range closing at a slightly lower level. This may be a lower close but it is still a new closing high along the uptrend. This however suggested that the bulls now prefer to rest while the bears are encouraged. The next couple of days start causing some concern about the ability of the upward move to sustain itself since these days open at the level where the market closed on the previous day and they close at slightly lower levels. In any case, the markets are still higher than the opening price of the first day even on the third day, and remember that the first day was a long white candlestick day. This observation shows that there was an attempt for reversal but it failed. Prices rise again to close at a new closing high apparently showing that the events of past few days were only a pause in a strong upward trend. It appears that attempts to reverse the trend occurred, but failed. The upward trend should continue.
Important Factors:
The Bullish Mat Hold Pattern is similar to the Bullish Rising Three Methods Pattern. The difference is that the reaction days, two, three, and four are altogether higher than those in the Bullish Rising Three Methods Pattern.
The reliability of this pattern is very high, but still a confirmation in the form of a white candlestick with a higher close or a gap-up is suggested.