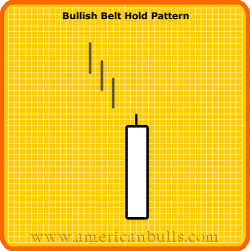
BULLISH BELT
HOLD PATTERN
| Type: | Reversal |
| Relevance: | Bullish |
| Prior Trend: | Bearish |
| Reliability: | Low |
| Confirmation: | Required |
| No. of Sticks: | 1 |
The Bullish Belt Hold Pattern is a single candlestick pattern. It is basically a White Opening Marubozu that occurs in a downtrend. As such; it opens on its low, then we see a rally during the day against the overall trend of the market, and then the day closes near its high but not necessarily at its high. If Belt Hold lines are characterized by longer bodies, then it means that they offer more resistance to the trend they are countering.
Recognition Criteria:
1. There must be an overall downtrend in the market.
2. The day gaps down, and the market opens at its low but then prices go
up during the day and they close near to the day’s high.
3. We see a white body that has no lower shadow that is a White Opening
Marubozu.
Explanation:
The market starts the day with a significant gap in the direction of prevailing downtrend. So the first impression reflected in the opening price is continuation of the downtrend. However; then the things change rapidly and the following price action of the day is the opposite of the previous trend. This obviously causes much concern among some shorts and leads to covering of many short positions. This accentuates the reversal and it may signify a rally for the bulls.
Important Factors:
The trend reversal implied by Bullish Belt Hold pattern requires further confirmation in the form of either a white candlestick, a large gap up or a higher close on the next trading day.