Introduction…a New Way to Look at Prices
Would you like to learn about a type of commodity futures price chart that is more effective than the type you are probably using now? If so, keep reading. If you are brand new to the art/science of chart reading, don’t worry, this stuff is really quite simple to learn.
Technical Analysis…a Brief Background
Technical analysis is simply the study of prices as reflected on price charts. Technical analysis assumes that current prices should represent all known information about the markets. Prices not only reflect intrinsic facts, they also represent human emotion and the pervasive mass psychology and mood of the moment. Prices are, in the end, a function of supply and demand. However, on a moment to moment basis, human emotions…fear, greed, panic, hysteria, elation, etc. also dramatically effect prices. Markets may move based upon people’s expectations, not necessarily facts. A market "technician" attempts to disregard the emotional component of trading by making his decisions based upon chart formations, assuming that prices reflect both facts and emotion.
Standard bar charts are commonly used to convey price activity into an easily readable chart. Usually four elements make up a bar chart, the Open, High, Low, and Close for the trading session/time period. A price bar can represent any time frame the user wishes, from 1 minute to 1 month. The total vertical length/height of the bar represents the entire trading range for the period. The top of the bar represents the highest price of the period, and the bottom of the bar represents the lowest price of the period. The Open is represented by a small dash to the left of the bar, and the Close for the session is a small dash to the right of the bar. Below is a standard bar chart example.
Candlestick Charts Explained
You may be asking yourself, "If I can already use bar charts to view prices, then why do I need another type of chart?"
The answer to this question may not seem obvious, but after going through the following candlestick chart explanations and examples, you will surely see value in the different perspective candlesticks bring to the table. In my opinion, they are much more visually appealing, and convey the price information in a quicker, easier manner.
What is the History of Candlestick Charts?
Candlestick charts are on record as being the oldest type of charts used for price prediction. They date back to the 1700's, when they were used for predicting rice prices. In fact, during this era in Japan, Munehisa Homma become a legendary rice trader and gained a huge fortune using candlestick analysis. He is said to have executed over 100 consecutive winning trades!
The candlesticks themselves and the formations they shape were give colorful names by the Japanese traders. Due in part to the military environment of the Japanese feudal system during this era, candlestick formations developed names such as "counter attack lines" and the "advancing three soldiers". Just as skill, strategy, and psychology are important in battle, so too are they important elements when in the midst of trading battle.
What do Candlesticks Look Like?
Candlestick charts are much more visually appealing than a standard two-dimensional bar chart. As in a standard bar chart, there are four elements necessary to construct a candlestick chart, the OPEN, HIGH, LOW and CLOSING price for a given time period. Below are examples of candlesticks and a definition for each candlestick component:
- The body of the candlestick is called the real body, and represents the range between the open and closing prices.
- A black or filled-in body represents that the close during that time period was lower than the open, (normally considered bearish) and when the body is open or white, that means the close was higher than the open (normally bullish).
- The thin vertical line above and/or below the real body is called the upper/lower shadow, representing the high/low price extremes for the period.
Bar Compared to Candlestick Charts
Below is an example of the same price data conveyed in a standard bar chart and a candlestick chart. Notice how the candlestick chart appears 3-dimensional, as price data almost jumps out at you.
( 3a ) ( 3b ) The long, dark, filled-in real bodies represent a weak (bearish) close ( 3a ), while a long open, light-colored real body represents a strong (bullish) close ( 3b ). It is important to note that Japanese candlestick analysts traditionally view the open and closing prices as the most critical of the day. At a glance, notice how much easier it is with candlesticks to determine if the closing price was higher or lower than the opening price.
Common Candlestick Terminology
The following is a list of some individual candlestick terms. It is important to realize that many formations occur within the context of prior candlesticks. What follows is merely a definition of terms, not formations.
- The Black Candlestick -- when the close is lower than the open.
- The White Candlestick -- when the close is higher than the open.
- The Shaven Head -- a candlestick with no upper shadow.
- The Shaven Bottom -- a candlestick with no lower shadow.
- Spinning Tops -- candlesticks with small real bodies, and when appearing within a sideways choppy market, they represent equilibrium between the bulls and the bears. They can be either white or black.
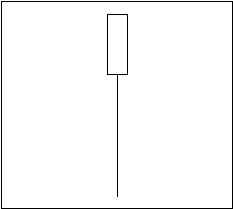
- Doji Lines -- have no real body, but instead have a horizontal line. This represents when the Open and Close are the same or very close. The length of the shadow can vary.
Candlestick Reversal Patterns
Just as many traders look to bar charts for double tops and bottoms, head-and-shoulders, and technical indicators for reversal signals, so too can candlestick formations be looked upon for the same purpose. A reversal does not always mean that the current uptrend/downtrend will reverse direction, but merely that the current direction may end. The market may then decide to drift sideways. Candlestick reversal patterns must be viewed within the context of prior activity to be effective. In fact, identical candlesticks may have different meanings depending on where they occur within the context of prior trends and formations.
- Hammer -- a candlestick with a long lower shadow and small real body. The shadow should be at least twice the length of the real body, and there should be no or very little upper shadow. The body may be either black or white, but the key is that this candlestick must occur within the context of a downtrend to be considered a hammer. The market may be "hammering" out a bottom.
- Hanging Man -- identical in appearance to the hammer, but appears within the context of an uptrend.
- Engulfing Patterns -- Bullish -- when a white, real body totally covers, "engulfs" the prior day's real body. The market should be in a definable trend, not chopping around sideways. The shadows of the prior candlestick do not need to be engulfed.
Bearish -- when a black, real body totally covers, "engulfs" the prior day's real body. The market should be in a definable trend, not chopping around sideways. The shadows of the prior candlestick do not need to be engulfed.
- Dark-Cloud Cover(bearish) -- a top reversal formation where the first day of the pattern consists of a strong white, real body. The second day's price opens above the top of the upper shadow of the prior candlestick, but the close is at or near the low of the day, and well into the prior white, real body.
Piercing Pattern (bullish) -- opposite of the dark-cloud cover. Occurs within a downtrend. The first candlestick having a black, real body, and the second has a long, white, real body. The white day opens sharply lower, under the low of the prior black day. Then, prices close above the 50% point of the prior day's black real body.
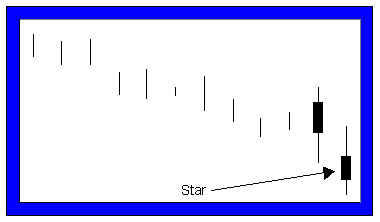
Stars
These candlestick formations consist of a small real body that gaps away from the real body preceding it. The real body of the star should not overlap the prior real body. The color of the star is not too important, and they can occur at either tops or bottoms. Stars are the equivalent of gaps on standard bar charts.
Stars make up part of four separate reversal patterns:
Morning Star
Evening Star
Doji Star
Shooting Star (Inverted Hammer)
Final Thoughts and Credits
It is important to realize that this introduction is just that, an introduction to candlestick analysis. After having read this, you will have merely scratched the surface of the many patterns and variables that can go into candlestick analysis. No attempt was made to provide a thorough analysis of each and every pattern. In fact, many formations were left out as they cross the border into more complicated analysis. For a more complete overview of candlestick analysis, it is highly recommended that you read the book that is referred to below.
A large portion of the material in this introduction is taken from an excellent book called Japanese Candlestick Charting Techniques: A Contemporary Guide to the Ancient Investment Techniques of the Far East. In some cases, sentences were taken almost verbatim, as there was no better way to say what Mr. Steve Nison, the author, already said. In his book, Mr. Nison, completely explains candlesticks and their formations, but more importantly explains how to combine candlestick analysis with traditional technical analysis. It is highly recommended that you consider purchasing this book from the ALTAVEST Online Bookstore.
As traders, we need as many trading tools in our arsenal, and a basic knowledge of candlesticks provides a trader much needed ammunition. Also remember that no matter what the trading tool, no matter how advanced or ancient, it is only effective when put into practice properly. This is, of course, your job as the trader.