2. Double Bottom
The Double Bottom pattern looks like the letter "W" and if recognized correctly can lead to a good entry point for investors. Some examples are shown below.
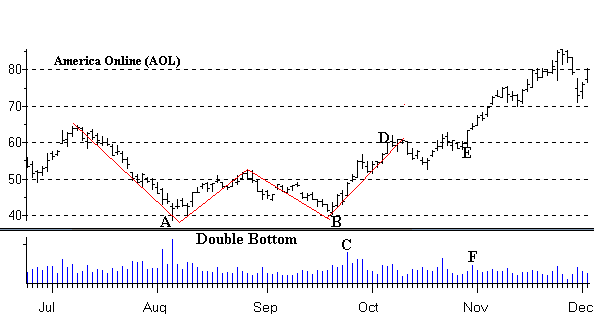
AOL formed a Double Bottom ("W" shape) this past Summer and Fall. Notice that after it made its first bottom (point A) in early August it then rallied briefly and then pulled back and made the second bottom (point B) in late September. AOL then rallied again to complete the "W" shape by early October. Investors that were able to recognize this Double Bottom pattern could have made a good entry point as AOL came out of the second bottom on increasing volume (point C). Meanwhile after forming the "W" shape AOL then traded sideways during the month of October (points D to E). Then AOL broke out of the trading range in late October with increasing volume (point F). Investors who recognized the Double Bottom pattern were rewarded with a 100% gain in eight weeks as AOL's price went from $40 to $80.
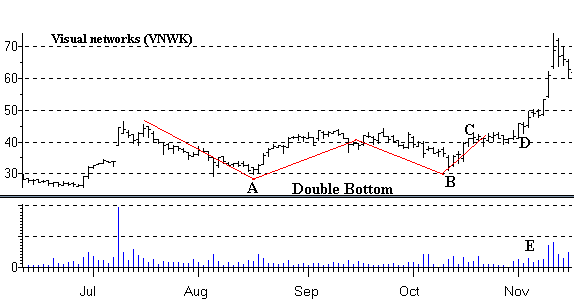
Another example of a stock making a Double Bottom was VNWK although this Double Bottom was much more elongated. Notice that VNWK made a top in mid-July and then pulled back to $30 by mid-August (point A). It then rallied back into the lower $40s in September and then pulled back again to around $30 by mid-October (point B). After forming the "W" shape VNWK traded sideways for two weeks (points C to D) and then broke out of its trading range in early November with increasing volume (point E). After breaking out VNWK went from the lower $40s to lower $70s in two weeks for a gain of 71%.