|
|
|
The Big M chart pattern is a double top
with tall sides. Price often approaches the low of the left side trend start (the launch
point -- see the below picture) before recovering.
|
|
|
|
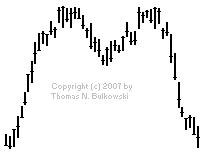
This is an ideal example of a Big M chart pattern.
|
Identification Guidelines
|
Characteristic |
Discussion |
|
Price trend |
Upward leading to the pattern. |
|
Shape |
A big M shape with twin peaks
and tall sides. |
|
Reversal pattern |
Look for a double top reversal
pattern at the top of the big M. |
|
Tall sides |
The left side of the big M
should be a tall, straight rise. |
|
Double top |
The double top should have
twin peaks with highs less than 4% apart. |
|
Drop between tops |
The drop between the peaks
of the double top is 10% to 20% or more. |
|
Breakout |
Look for a downward breakout.
That’s when price drops below the right side of the big M. |
|
Confirmation |
The pattern confirms as a
valid one when price closes below the lowest valley between the double tops. |
Trading Tips
|
Trading Tactic |
Explanation |
|
Measure rule |
Compute the height from the highest peak
(A) to the lowest valley (B) and then divide by 2. Add the result to the highest peak (upward breakouts, C)
or subtract it from the confirmation point (B) to get
a downward breakout target (D). The
result is the target price. The link to the left explains the measure rule. If
you are lucky, price will bottom (D) at the launch
price (E).
|
|
Breakout |
Upward breakouts occur when price closes above the highest
peak of the big M, point A in the chart to the right.
Downward breakouts occur when price closes below the confirmation price (the lowest
low in the Big M chart pattern, B in this case).
|
|
Stall |
For swing traders, sell short at the second double top peak
(F) and ride price downward to confirmation of the
double top (the low between the two peaks, B). If
price rises above the highest peak in the pattern (A),
consider exiting the position because price is likely to continue higher. If price
confirms the double top, expect the decline
to approach the left side low (E). It usually does not
make it all the way down, but it will be close.
|
|
Position traders |
Wait for confirmation of the double
top (price to close below B) before taking a position
and be prepared to exit the position as the stock nears the price of the left side
low (E). |
|
|
|
Example
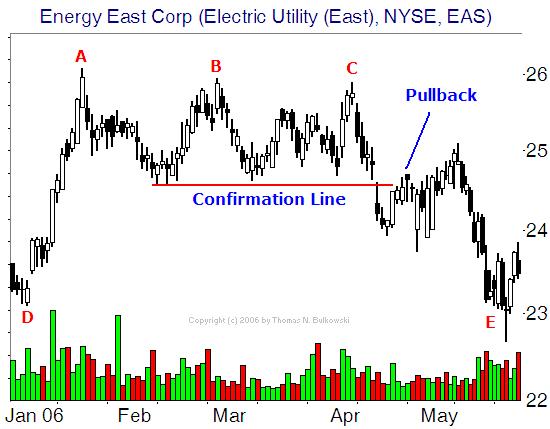
The above figure shows an example of an unusual Big M chart pattern. In this example, a triple top
(ABC) replaces a double top (AB) in the Big M. In my trading,
I allow many reversal patterns, such as ascending, descending or symmetrical triangles, triple tops, and so on, to replace the double top.
In this example, price breaks out when it closes below the horizontal red
confirmation line then pulls back before resuming the downward march. Price at E,
reaches the launch price of D almost exactly before staging a recovery. Notice the tall,
straight-line run up from D to A and the slower decline from
C to E.
|
|