The Patterns
There are currently 8 patterns in Woodies CCI.
Woodie has defined all of them. Do not follow any other
methods, patterns or systems. They will add another level of complexity and
will only serve to confuse you while you are learning this system.
Do not rename any of the patterns. I’m sure it is very
obvious why this shouldn’t be done but some still try to do it. You could go
ask the traders that tried this but they are no longer trading. Just stick
to the system as Woodie has defined it.
Woodie is researching and testing new patterns all the
time. He will let us know when he finds another great new pattern.
Woodies CCI Patterns can be used on any time frames. It
can even be used very successfully on daily charts and larger time frames as
well. Note that Woodie uses a CCI 20 period on charts with daily time frames
and larger. He does not use the TCCI at all on the daily or larger time
frame charts.
You want to take CCI patterns that are robust,
full-bodied, and clear. Not ones that are constricted, tightly wrapped
around the zero-line, condensed or strange looking. There are far too many
trades to take during the day for you to force a bad trade. Re-read this
again and again. Follow it closely. This is one of the parts of Woodies CCI
system that keeps you from over trading. You do not need to think about
overtrading. Just follow the guidelines and it will be taken care of
automatically.
The Woodie CCI Patterns that we use to trade are as
follows and are not necessarily listed in order or winning percentages.
#1 - Woodies CCI Zero-line Reject
(ZLR) Pattern:
A zero-line reject (ZLR) pattern is a CCI bounce off of
or near the zero-line (ZL). It can bounce off of or near the zero-line
anywhere from +100 to –100 for both long and short trades. Some people like
to narrow the range down to +/- 50 which can provide a better pullback. The
entry would be the first bar that rejects or flips up away from the
zero-line.
The market psychology behind Woodies CCI ZLR pattern is
that it shows traders when to buy the dips and sell the pullbacks. No other
indicator in the trading world can do that except for the CCI.
You can combine the ZLR pattern along with a trend line
break (TLB) pattern to add strength to the signal for a greater probability
of success. If using the ZLR along with the TLB then you would wait for the
CCI to cross the TLB pattern to enter. You will learn more about the trend
line break (TLB) pattern later in this document.
The ZLR trade is a trend trade. New traders of Woodies CCI
should be taking this type of trade. In fact this could be the only Woodies
CCI pattern trade you take during your entire trading career and still
create excellent profits for yourself
|
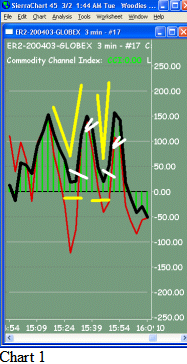
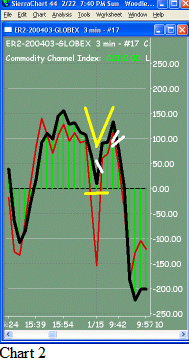
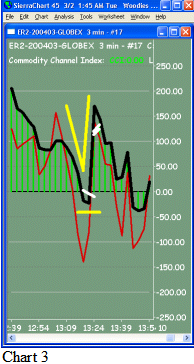
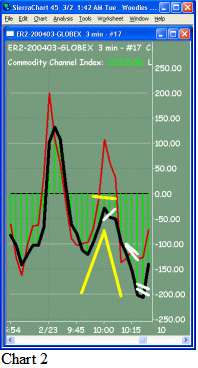
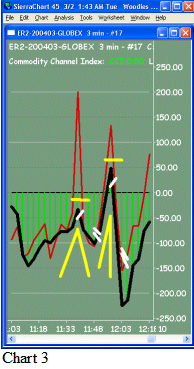
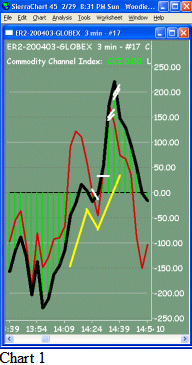
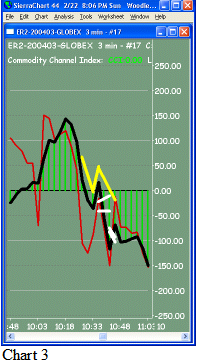
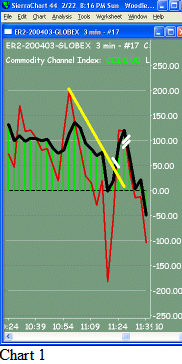
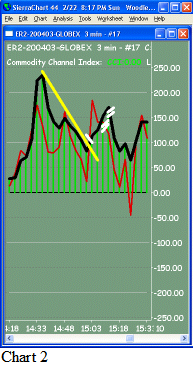
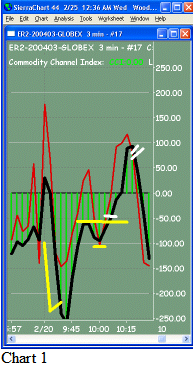
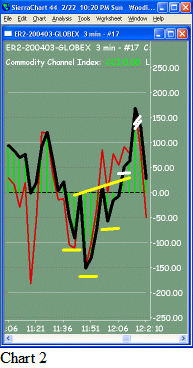
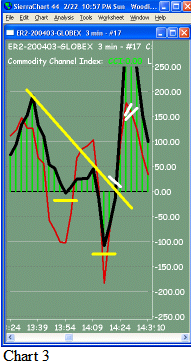
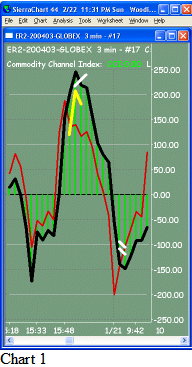
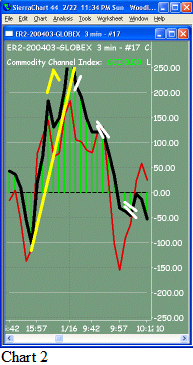
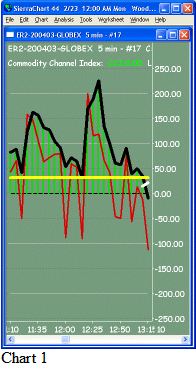
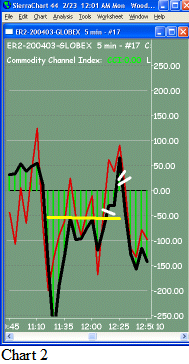
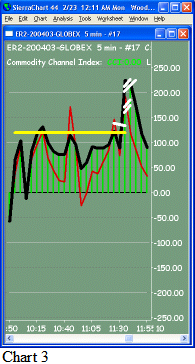
3 Charts Below –
Zero-line Reject (ZLR) long trades.
The yellow lines show the ZLR patterns. The
single white lines show where the entry would be and the double
white lines show where the exit would be |
 |
|
 |
|
 |
| Zero-line
Reject (ZLR) long
TREND TRADE
Notice that chart 1 above shows two ZLR long trades. They
both bounce off the ZL within the +/-100 area. We enter a ZLR
when the CCI line first starts to reject the ZL or we can say
the first bar that flips away from the ZL.
In chart 1 above we exit the first ZLR on a CCI hook and the
second ZLR we exit on a TCCI cross into CCI. |
|
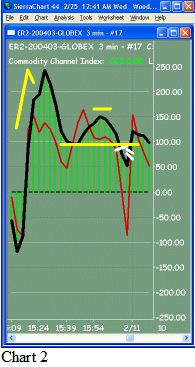
Zero-line Reject (ZLR) long
TREND TRADE
In chart 2 above we exit on a CCI hook. |
|
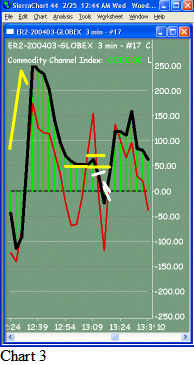
Zero-line Reject (ZLR) long
TREND TRADE
In chart 3 above we exit on a TCCI cross into CCI.
Notice that on chart 3 above the CCI hooks at the same time the
TCCI hooks which gives us two exits signals at the same time.
|
|
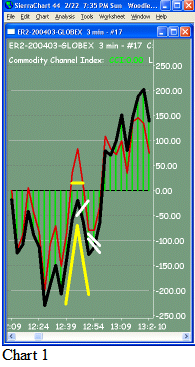
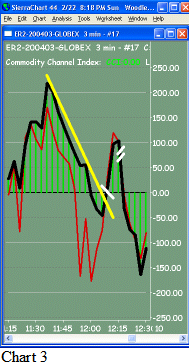
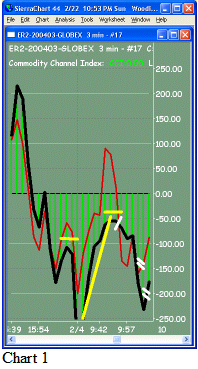
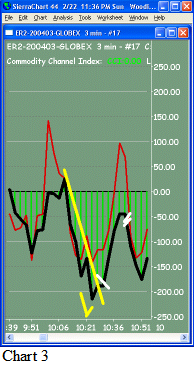
3 Charts Below –
Zero-line Reject (ZLR) short trades.
The yellow lines show the zero-line reject patterns.
The single white lines show the entry for this type of trade and the
double white lines are the exit signals.
The exit signals are the same as in any other
trade. Go review the section on how to enter and exit trades.
It is very important to remember that when you take
one of these trades it does not mean you are supposed to stay in it
forever. Always follow Woodies CCI exit signals |
 |
|
 |
|
 |
|
In chart
1 above we see that the ZLR was close to the ZL. The exit on this
trade was a CCI hook.
Zero-line Reject (ZLR) short
TREND TRADE
|
|
In chart
2 above we also see a ZLR close to the ZL. There are two exits on
this chart. One is a TCCI cross of CCI and the second exit is a CCI
hook. We don’t know what the trade will give us before we get in and
we don’t care. We take the exits as they come and it works out very
well.
Zero-line Reject (ZLR) short
TREND TRADE
|
|
In chart
3 above we see two ZLR trades. The first ZLR exit is a CCI hook.
Notice that the second ZLR is a bounce off the zero-line from the
opposite side. This is fine. In fact it could go as high as +100 and
we could still take it as a ZLR short trade. Remember that some
people prefer to take ZLR trades that are closer to the ZL within
the +/-50 area.
Zero-line Reject (ZLR) short
TREND TRADE |
#2 - Woodies CCI Shamu Trade (shamu)
Pattern:
A shamu pattern is when the CCI passes through the
zero-line (ZL), flips back around and comes through the ZL again, and then
once again turns around and crosses through the zero-line to continue its
original direction. It’s sort of a zigzag pattern around the ZL. It doesn’t
have to be directly on the zero-line but it’s better when it is. When the
zigzags on the CCI happen within the +/-50 area it makes for a better
pattern.
Notice that the shamu trade pattern is a failed
zero-line reject pattern. Originally it was a ZLR pattern. But the ZLR
turned around and failed so we had to exit. This is why you do not wait
around and hope a trade is going to correct itself and go back your way. If
you were in all of these trades as the initial ZLR trade and it turned on
you but you did not exit then you would be racking up potentially large
losses. You must exit based on the guidelines Woodie has created. That is
the defined system. You have no choice.
The shamu trade is a counter-trend trade and was developed as
a type of stop-and-reverse (SAR) trade to the failed ZLR. New students of
Woodies CCI should not be taking this type of trade. However,
keep your eye on it and learn as you progress
|
3 Charts below – Shamu Trade
Pattern.
The yellow lines show the CCI pattern. The
single white lines show where the entry would be and the double
white lines show where the exit would be. The single white lines
show the entry for this type of trade and the double white lines are
the exit signals.
A Shamu Trade failure pattern is not shown. A
failure of the Shamu Trade would be yet another swing back through
the zero-line after our trade entry to take out the other side of
the prior swing low/high. It does happen and all you do is exit
based on the rules defined by Woodies CCI.
On all 3 charts there are
two possible entry points shown as single white lines. It depends on
if you always add confirmation signals to your trades. If you do
then when taking the shamu trade then let it take the swing high/low
out for the entry signal. However, most people would enter the trade
on the first white line. If however the shamu pattern is a perfect
one and is evenly split across the zero-line then the entry could be
the zero-line cross (ZLC).
The exit signals are the same as in any other
trade. Go review the section on how to enter and exit trades.
It is very important to remember that when you
take one of these trades it does not mean you are supposed to stay
in it forever. Always follow Woodies CCI exit signals. |
 |
|
 |
|
 |
|
Shamu Trade long pattern
Counter-trend trade |
|
Shamu Trade long pattern
Counter-trend trade |
|
Shamu
Pattern Short
Counter-trend trade |
| X |
| Chart 2 shows two
possible exits for the trade. The first set of double lines is when
the TCCI is crossing into the CCI. You would exit your first
contract at that point. If you were trading more than one contract
you would then set the rest to b/e+1 and wait for the next exit
signal to come. We see that the second exit signal is the second set
of double white lines showing the HFE exit signal. Chart 2
shows a shamu trade pattern that doesn’t quite come down below
the zero-line. That’s ok. Not every pattern can be perfect. It's
still a valid shamu trade.
|
#3 - Woodies CCI Trend Line Break
(TLB) Pattern:
A Trend Line Break pattern uses two or more decent
sized bumps, using CCI or TCCI, to lay the trend line across them. Then when
the CCI crosses or breaks that trend line (tl) that is the signal to enter
the trade. One end of the trend line should be at CCI value +/-100 region or
greater for it to be valid. Also, the more bumps you lay it across the more
valid that trend line is. Using only two bumps is normal and creates a
perfectly valid TLB. You can also mix the use of CCI and TCCI bumps for each
trend line. This pattern is also used as one of the exit signals and as a
CCI confirmation signal too. It comes in quite handy and is widely used in
Woodies CCI system.
The TLB trade can be both a trend and a counter-trend
trade. New students of Woodies CCI should be taking this type of trade if it
is a TLB with the trend. Do not take this trade against the trend. However,
keep your eye on it and learn as you progress.
You can combine the zero-line reject (ZLR) pattern and
the reverse divergence (rev diver) pattern along with a TLB pattern to add
strength to the signal for a greater probability of success. When combining
these together you would still enter on the break of the trend line, as it
will occur last.
Another method of entry on a TLB trade is to use the
CCI confirmation signal cross of the +/- 100 value. This provides a greater
chance that the trade will be successful. You do not have to use this method
and you may get more profit on the TLB trade if you get in well before this
point. However, if you do not add the CCI confirmation of a +/- 100 cross
then your TLB trade might not work out so often. Pick a method and stick
with it. Don’t change daily.
You will very often find the TLB and ZLR show up
together. Sometimes the rev diver pattern will show up with them as well.
You should start to notice that CCI patterns all come one after another and
also form together to make stronger signals. Do not let this confuse you.
You only need one CCI pattern to take a trade. However if you combine more
than one signal it adds to the probability of success for that trade.
|
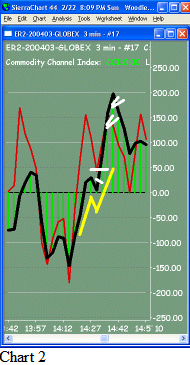
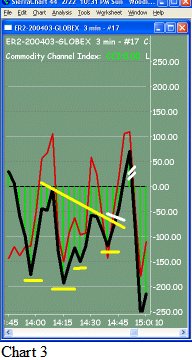
3 Charts below – Trend Line
Break Patterns.
The yellow lines show the CCI pattern. The
single white lines show the entry for this type of trade and the
double white lines are the exit signals.
Note that all 3 charts show the Trend Line
Break pattern with the trend. No TLB counter-trends are shown. In
the 1st chart we can see how the TCCI was used to draw the Trend
Line Break trade. This is valid and works well.
The exit signals are the same as in any other
trade. Go review the section on how to enter and exit trades.
It is very important to remember that when you take
one of these trades it does not mean you are supposed to stay in it
forever. Always follow Woodies CCI exit signals. |
 |
|
 |
|
 |
| Trendline
Break Pattern Long |
|
Trendline Break Pattern Long
There are two exit signals. One is where the TCCI crossed into
the CCI. The second exit is when the CCI hooks.
The entry method of waiting for the CCI cross of the
+/-100 is shown in the 2nd chart but just happens to be
there by coincidence |
|
Trendline
Break Pattern Long |
#4 - Woodies CCI Vegas Trade (VT)
Pattern:
The Vegas Trade Pattern is a combination of several
things. First it needs the hook from extreme (HFE) CCI pattern and then a
set of CCI bars shaped into a partial circular or rounding pattern following
that. These rounding bars must be at least 3 bars minimum and can occur
toward the zero-line or against it. In other words the rounding can be in
any direction regardless of what side of the zero-line (ZL) the entire
pattern is being formed on. However, the entire VT pattern must form on the
same side of the zero-line.
This means that the swing high/low part of the pattern
doesn’t have to be the rounding part of the pattern. However, it is a
stronger signal when the swing high/low is the rounded part. Also, it can
even have two or more swing high/lows as well. The rounding is very
important to the overall pattern and indicates a struggle that may well lead
to a strong trend reversal.
That last part of the pattern is the trend line drawn
straight across from the recent swing high or low. A break of this swing
high/low is our entry into the trade.
The entire Vegas Trade pattern can have anywhere from
around 8 to 12+ bars but when it gets too far spread out past that before an
entry signal is seen then the probability of success is lowered and the
strength of move could be less.
The Vegas Trade pattern indicates a potential for a
very strong change in the trend.
Also, Woodie strongly recommends the use of the 25-lsma
indicator as an additional criterion for VT entry. When the 25-lsma
indicator shows that price is on the side of the direction of the VT entry
then there is a greater likelihood that the trade will be successful. LSMA
stands for Least Squares Moving Average and can also be found in some
charting packages as Linear Regression Curve.
In other words, if the VT is setting up for a long
entry then you want price to be above the 25-lsma indicator and, if
possible, you also want the 25-lsma to be pointing in the upward direction
as well. If a VT short is setting up then you want the price to be below the
25-lsma and, if possible, you want the 25-lsma to be pointing downward.
Since we do not use prices to trade Woodies CCI system it is recommended
that you do not view prices just to see a 25-lsma indicator. Rather, use a
25-lsma indicator placed in the CCI region that displays colors showing
these four conditions.
|
|
 |
|
 |
|
 |
| Vegas Trade
Pattern Long
counter-trend Trade |
|
Vegas Trade
Pattern Short
counter-trend Trade |
|
Vegas Trade
Pattern Short
counter-trend Trade |
| x |
| Chart 1
shows very limited rounding. Neither the swing high after the HFE
nor the swing low after that shows very good rounding. It has 3 bars
of rounding minimum so it’s still valid. However, be careful as it
could likely fail as a result of that. It may be best to stay away
from this trade since it does not have the good rounding expected.
There will be many other vegas trade (VT) patterns that could be
taken so passing on a lame one won’t hurt.
Chart 2 shows rounding on the swing low and the swing high. The
entry signal is still the break of the swing low since it is above
the zero-line. Notice that the entire pattern is more than 12 bars
so the probability for success is far less
Chart 3 shows very nice rounding after the HFE pattern. The best
Vegas Trade patterns have the swing high/low part as the rounding
section. It also shows an interesting sharp flip of the CCI bar
downward that happens next and breaks the swing low. Since it broke
the recent swing low, in this case, it gives us our CCI entry signal
to take the trade
All CCI patterns can’t be perfect but keep in mind that the
closer the pattern conforms to the definition the greater the
likelihood that it will be successful.
Remember that you will want to only take trades
where the 25-lsma indicator shows that prices are on the side of the
trade and, if possible, the 25-lsma indicator also is pointing
toward the direction of the trade. The 25-lsma indicator is not
shown in these charts. If it were shown you would see it located on
the zero-line in the CCI section using a multi-color indicator to
display it.
The exit signals are the same as in any other
trade. Go review the section on how to enter and exit trades.
It is very important to remember that when you
take one of these trades it does not mean you are supposed to stay
in it forever. Always follow Woodies CCI exit signals.
|
#5 - Woodies
CCI Ghost Trade Pattern:
Ghost
article
The Ghost Trade pattern has 3 bumps in it. It has an
arm, a head and then another arm in its pattern. The bumps used to spot this
pattern can be made from the CCI or the TCCI. However, most people use CCI
bumps for this pattern. It is preferable that the head is larger then the
arms. To determine the entry point for the Ghost trade you draw a trend line
across the underside of the Ghost across its neckline.
You can gauge the expected CCI movement for the Ghost
Trade by measuring the distance from the top of the head to the neckline.
The expected movement would then be a movement of that same distance from
the neckline in the opposite direction to that of the head. You do not need
to bother calculating the potential CCI move from the neckline as you will
be exiting the trade as soon as the CCI gives you an exit signal anyways.
All you need to do is follow the exit signals as defined in Woodies CCI.
Notice that when you draw the neckline (trend line) on
the Ghost pattern you combine a trend line break (TLB) pattern along with
the Ghost pattern which adds strength to the signal for a greater
probability of success. Sometimes the neckline will slant toward the
zero-line. These are the preferred Ghost patterns over the ones in which the
neckline slants away from the zero-line. However, both are fine to take.
|
The yellow lines show the CCI pattern. The
single white lines show where the entry would be and the double
white lines show where the exit would be.
Notice how all the necklines slant different
ways. Some slant toward the zero-line and some away from it. Do not
let this confuse you. Just enter the trade once it breaks the
neckline, which is otherwise known as the TLB CCI pattern as well.
This is yet another example of how the CCI patterns can and quite
often do run together.
Be aware that the majority of the drawn Ghost
pattern must be on the same side of the CCI zero-line. Sometimes a
bit of it does form on the opposite side. This is perfectly fine if
it is only a very small portion.
The exit signals are the same as in any other
trade. Go review the section on how to enter and exit trades.
It is very important to remember that when you
take one of these trades it does not mean you are supposed to stay
in it forever. Always follow Woodies CCI exit signals.
|
 |
|
 |
|
 |
| Ghost Trade
Pattern Short
counter-trend Trade |
|
Ghost Trade
Pattern Long
counter-trend Trade |
|
Ghost Trade
Pattern Long
counter-trend Trade |
|
Chart 1 has a very weak right arm.
Notice that the trade didn’t go very far before it hooked back up
and we had to exit.
Chart 3 shows a Ghost pattern that had a
double head. That’s fine. Not all CCI patterns can be perfect.
|
#6 - Woodies
CCI Reverse Divergence (rev diver):
The Reverse Divergence (Rev Diver) pattern is very
simple. Do not let if confuse you. However, many people find it hard to
understand and even harder to spot. This shows us two things. One, the
documents and explanations are too hard to understand and just possibly
confuse the matter. Two, and more interesting, is that it may show us that
by bringing in your prior ‘knowledge’ into Woodies CCI system will give you
headaches when trying to understand it.
This pattern was named using words that remind you of
things you have tried to learn before. Maybe that is the reason why people
find it so hard to spot. Forget the name and do not let it conjure up your
past knowledge. None of that will help you and is absolutely not needed any
longer. So forget everything you think you know about it. Do not question
the pattern or why it works at this stage. Just learn to spot its ‘look’.
It’s a very simple pattern I assure you.
You do not need prices to trade the Rev Diver
pattern. You do not need to verify that it is a true reverse
divergence pattern against price before you enter the pattern. We do not use
prices to trade Woodies CCI system. Woodie has done many years of research
and live trials on this pattern. He has determined that it truly is reverse
divergence when compared to price over 95% of the time. This is why we as
traders do not have to verify it against prices. We just react and take the
trade. Besides, lets say it turns out not to be a true rev diver pattern
when compared to price bars. The CCI will warn us anyways by showing us one
of the Woodies CCI exit signals.
The following two rules are all you need to spot the
Rev Diver pattern:
- Rev Diver long – CCI above zero-line for 6 or more
bars, two lower inside bumps
- Rev Diver short – CCI above below line for 6 or
more bars, two higher inside bumps
The Reverse Divergence Trade is a trend trade. New
students of Woodies CCI should be taking this type of trade.
You can combine the Rev Diver trade with a zero-line
reject (ZLR) trade or the trend line break (TLB) trade to add strength to
the signal for a greater probability of success. You most always have a ZLR
pattern along with a Rev Diver pattern. In fact you usually have two ZLR
patterns that make up a Rev Diver since both inside bumps usually occur
within the +/- 100 CCI area. The inside bumps actually represents the CCI
ZLR pattern. Look at the charts closely and you will see both of them on
each chart.
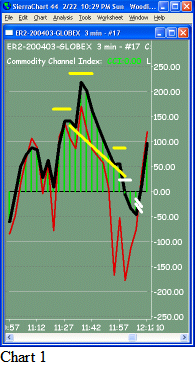
|
The yellow lines show the CCI pattern. The two
short yellow lines show the Reverse Divergence Trade pattern. The
longer yellow line shows the Trend Line Break pattern that usually
accompanies this trade. The single white lines show where the entry
would be and the double white lines show where the exit would be.
Each chart shows a short yellow line where each
inside bump can be see within the pattern. Notice that the inside
bumps are closer to the zero-line as they move across the chart. Two
of the inside bumps shown actually go over the zero-line. In chart 2
you can see one inside bump goes over the zero-line a little bit.
|
 |
|
 |
|
 |
|
Reverse
Divergence (rev diver) Pattern Short
Trend Trade |
|
Reverse
Divergence (rev diver) Pattern Long
Trend Trade |
|
Reverse
Divergence (rev diver) Pattern Long
Trend Trade |
|
Chart 3 one inside bump goes down under
the zero-line a great deal. Technically this turned into an outside
bump since it went down below the zero-line.. Don’t let this
confuses you. It is still a rev diver pattern but you may want to
avoid ones that do this. You could instead take this as a ZLR trade
on the first bar that flipped up since it only went down to –100.
Again, all of these patterns melt together in some fashion all the
time. Don’t worry about it. You will be fine. Just keep on reading.
However, as you know by now, we look for the
more perfect CCI patterns to trade and the rev diver in chart 3
might not be a trade to take since it does go over the zero-line
quite a bit and for 3+ bars as well. It is interesting enough to
note that the trade was really strong and went quite far upward
anyways. In fact, you could just ignore the rev diver pattern on
chart 3 and take it as a simple TLB trade. I hope you are seeing by
now that all of Woodies CCI patterns mix together or come one right
after the next.
Notice that there is a zero-line reject (ZLR) pattern
just before each of these rev diver entries on all 3 charts. This is
not a coincidence. Lots of CCI patterns run together. Some will add
to the potential for success and some will signal you
to exit immediately because they are setting up a CCI trade signal
against your current position. Don’t let this confuse it. It’s
normal to see multiple Woodies CCI patterns combined together.
All 3 charts are showing the trend line break
(TLB) pattern drawn as well. Most people use a rev diver pattern
along with a TLB pattern as a signal for more confirmation to enter
the trade. You can clearly see this in charts 2 and 3 where the
entry is shown after the TLB is broken However, you could enter the
trade right after the second ZLR CCI turn up/down that forms the
complete rev diver pattern. This entry by itself would be a rev
diver trade with the added confirmation of a TLB.
Chart 1 shows two exits using the double
white lines. Again, the first contract or set of contracts would be
exited at the first set of double lines. The remainder of the
position would be set to b/e+1 and you would wait for the next exit
signal.
Chart 3 shows a lower inside bump that
actually goes onto the other side of the zero-line. This is a nuance
and does happen. That is fine. Important to point out is that this
is actually a valid zero-line reject long signal since it doesn’t go
past the CCI –100 area. This one goes a bit further so it could be
taken with caution.
The exit signals are the same as in any other
trade. Go review the section on how to enter and exit trades.
It is very important to remember that when you
take one of these trades it does not mean you are supposed to stay
in it forever. Always follow Woodies CCI exit signals.
|
#7 - Woodies
CCI Hook From Extremes (HFE) Pattern:
The hook from extreme (HFE) trades are formed when the
CCI prints a bar at or past the +/- 200 and then starts hooking back toward
the zero-line. This trade is a very difficult trade. The HFE pattern is used
as one of the Woodies CCI exit signals as well.
A HFE trade can happen very fast. As soon as you see it
hook back toward the zero-line you enter. Make sure you have your hard
stop-loss orders in as soon as you get filled on entry, as this trade can
get away from you very quick. As soon as you see a signal to exit then you
exit immediately.
You will get stopped out of this trade often and this
can happen even without seeing a CCI exit signal. This trade has around a
50% chance of success if you take every single HFE trade you see. However it
can provide you with much larger profits than losses. You must use hard
stop-loss orders when trading Woodies CCI or any other system for that
matter.
You can combine the HFE trade with either a trend line
break or a +/- 100 cross CCI confirmation signal to add strength to the
trade for a greater probability of success. Again, when new you are not to
take this trade. There are a great many experienced traders that do not take
this trade either.
|
The yellow
hooking lines show the CCI pattern. The long yellow lines show the
TLB pattern that also exists on these charts. The single white lines
show where the entry would be and the double white lines show where
the exit would be.
The exit signals are the same as in any other
trade. Go review the section on how to enter and exit trades.
It is very important to remember that when you
take one of these trades it does not mean you are supposed to stay
in it forever. Always follow Woodies CCI exit signals. |
 |
|
 |
|
 |
|
Hook
From Extremes (HFE) Pattern Short
counter-trend Trade |
|
Hook
From Extremes (HFE) Pattern Short
counter-trend Trade |
|
Hook
From Extremes (HFE) Pattern Long
counter-trend Trade |
|
Chart 1 we enter on the first CCI bar
that flips back toward the zero-line when outside of the +/-200 CCI
area. There is no real defined trend line since we do not have any
nice bumps to draw it on. This is fine.
Chart 2 shows the entry after the break
of the trend line and two exit points. The first exit is when the
tcci hooks through the CCI. The second exit is also a tcci hook into
the cci and the cci is starting to hook at the same time as well.
Charts 2 and 3 are showing
the TLB added to the HFE trade. That provides a greater probability
of success. The entry would be when the CCI line breaks the TLB
pattern. |
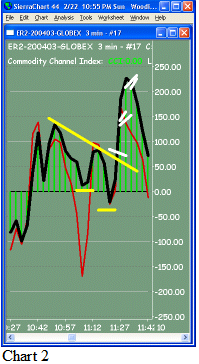
#8 - Woodies
CCI Horizontal Trend Line Break (HTLB) Pattern:
The horizontal trend line break (HTLB) trade is when a
trend line is drawn horizontally across a series of bumps that are lined up
in a nice straight row. You can use a mix of both CCI and TCCI bumps to draw
the htl but most often you will see the CCI used in these patterns.
You can draw the trend line across these bumps
regardless of whether they are inside or outside bumps as well as on either
side of the zero-line. Of course since it is a horizontal trend line all the
bumps will be on the same side of the zero-line. It is best to have the
break of the HTLB pattern within the +/- 50 area so that there will be a
greater possibility of success.
You would ideally like to have 3+ bumps on which to
draw the htl. However, you must have at least 2 bumps and this is fine. Each
bump at the same horizontal level can show that there is some type of
support/resistance building up at that area. When broken through it can lead
to a strong movement and a great trade. You will usually see a HTLB pattern
in a choppy market. The HTLB trades can make for some of the very best
trades during that choppy market.
The HTLB trade can be both a trend and a counter-trend
trade. New students of Woodies CCI should be taking this type of trade if it
is a HTLB trade with the trend. Do not take this trade against the trend.
However, keep your eye on it and learn as you progress.
The exit signals are the same as in any other trade. Go
review the section on how to enter and exit trades.
|
The yellow lines show the CCI pattern. The
single white lines show where the entry would be and the double
white lines show where the exit would be.
Note
that the charts are 5 min charts. Woodie says that you can have a
good HTLB pattern on the 3 min chart but that the HTLB pattern on
the 5 min charts are even stronger in terms of probability for
success. |
 |
|
 |
|
 |
|
Horizontal Trend Line Break (HTLB) Pattern Short
counter-trend Trade |
|
Horizontal Trend Line Break (HTLB) Pattern Long
counter-trend Trade |
|
Horizontal Trend Line Break (HTLB) Pattern Long
Trend Trade |
|
Chart 1 does not show the
exit signal to the trade. Rather the snapshot was used to show a
long term HTLB forming. This led to a very powerful move but is not
shown on the chart.
Charts 1 and Chart2 show HTLB patterns
that are counter-trend trades. These are counter-trend trades
because the CCI is on the opposite side of the trade entry direction
for 6+ CCI bars. If you are new to Woodies CCI you should not
take these two trades since they are counter-trend trades.
Chart 3 shows
a HTLB trade with the trend. The entry is when the CCI line breaks
through the long horizontal trend line. If you are new to Woodies
CCI then you should take this type of trade |