The Trend
Woodie has defined the trend using the CCI indicator
only.
Woodie does not use price bars to define the trend.
Woodie does not use the 34-ema to define the trend.
Woodie does not use a larger time frame to define the
trend.
Woodie uses the same chart to define the trend as he
does to spot a CCI pattern for that market.
Each market will have its own trend and is not to be
considered when taking a trade on another market.
You do not need any other charts, markets or indicators
to see and define the trend.
When learning Woodies CCI system you must trade with
the trend. You do not trade counter-trend trades.
1 Chart Above – Zero-line (ZL).
Woodies CCI trend definition is as follows:
If you are new to trading Woodies CCI system then you
should only look for trades that are with the trend until you no longer need
this document.
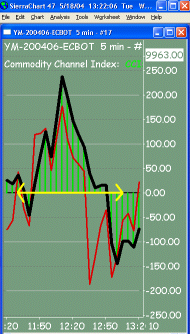
The CCI zero-line (ZL) is a very important and integral
part of Woodies CCI system. All of Woodies CCI patterns are defined around
the zero-line. It represents major support and resistance at this moment in
time. I repeat, at this moment in time. This means that it does not
represent a forward-looking projection of where the support and resistance
will be in moments from now. The CCI patterns will be adjusted accordingly
as the market moves and thus create a new current ‘here and now’ zero-line.
The zero-line is tested over and over throughout the trading day.
Furthermore, the CCI +/- 100 value line represents
minor support and resistance at this moment in time as well. The CCI +/- 200
and greater values represent overbought (+200 and higher) and oversold (-200
and lower) market conditions at this moment in time.
While a trend is taking place as defined by the 6+ bar
rule you can have a few bars print on the other side of the zero-line and
still maintain the current trend. But as soon as you see 2+ bars in a row on
the other side of the zero-line then you should back off from looking for
trades and wait to see what will happen with the trend. The trend might be
changing. There is no need to be taking trades unless we are sure of what
the market is telling us. Just be patient and wait.
Also, when bars are printing on both sides back and
fourth every few bars it is telling you that there is no clear trend so you
should not be taking any trades at all. Just stand back and wait. There will
be plenty of good trades later. We do not take trades when there is no clear
trend. Period.
Until you are following these guidelines consistently
and making profits you should only be taking trades that are with the trend.
Stay away from trades that are counter-trend.
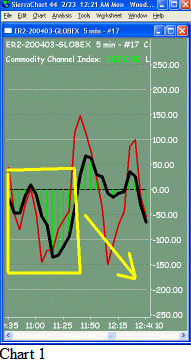
We see that in chart 1 the yellow box has 6+ CCI bars
below the zero-line so we are looking for shorts. Also notice in chart 1
that after the square yellow box the CCI crosses the zero-line and prints
bars above it. For the first couple bars that are printing above the
zero-line, maybe 1 to 2 CCI bars or 3 maximum, we would still be looking for
shorts. But be warned that the more bars that print above the zero-line the
more we would stop looking for short trades and start counting the number of
bars above the zero-line. Once we can count 6 or more bars above the
zero-line then so we can start looking for long trades.
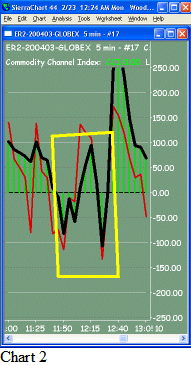
In chart 2 we see a mix of bars above and below the
zero-line. It looks like a mess. No real defined direction so no real trend.
Just stay away from trading and wait until we get a solid set of 6 or more
bars on either side. When no trend is defined then we cannot take any
trades. This is one of the ways Woodies CCI System forces you to not over
trade. It’s built into the system. You don’t have to think about it. It just
happens if you follow the rules.
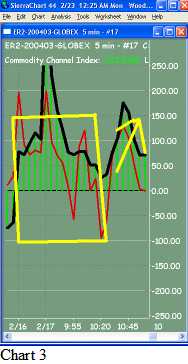
In chart 3 we see a clear trend of 6+ CCI bars above
the zero-line so we are looking for longs.
After there is a clear trend defined you will look for
CCI Patterns to take trades in the direction of the trend. Again, if you are
new and still need this document then stay away from counter-trend trades.
Also remember that many very experienced traders only take trend trades as
well. After all the market should be moving in the direction you want to
trade it to start with. There is no reason why you can’t take trend trades
your whole entire trading life. It’s natural, it’s normal and it’s highly
recommended that you do take trades with the trend.
Woodies CCI Patterns that are trend trades:
Woodies CCI Patterns that are counter-trend:
Again, when new to Woodies CCI you should only take
trend trades. Do not take counter-trend trades. You will notice that some of
the trades are both trend and counter-trend type trades. If you are new then
you just take that pattern when and only when you see it develop in the
direction of your trend.
You will learn all of these patterns later in this document. They are all just simple CCI patterns defined by Woodie that you will learn to spot on your charts in order to take a trade. Using Woodies CCI patterns instead of everything else allows you to forget all the ‘knowledge’ you have about trading, take advantage of the momentum of the market movements and, more often, beat other traders into and out of the market by one or more bars. All this is done without emotions, guessing or confusion about whether you should be in or out of a trade. Simple as that.