These contributions are from Mike Bruns, world class trader. Mike's clear thinking and charts have allowed for many traders to finally "get it". His generous sharing and teachings have helped me raise my level of trading. Reinforcing the concepts of trading with the trend, his knowledge of the bond market and other markets. Mike also gives after market hours seminars for members, they are exceptional. My personal thanks Mike...NQoos
If you desire to be a profitable trader and understand the value of learning from other successful traders then efuturevsion.com is a perfect vehicle to accomplish this. This is only a sampling of the expertise in trading education available in the efuturevision chat room, website and after hour seminars for members. The education section and Trading notes section on efuturevision is open to the public. These contain setups and information from Victoria, Mike, Jimmer, Brian, Ross and others. All profitable traders. Members can access much more valuable trading information than what is in the general public areas. If this is still you, choose today to change.
MACD Aggressive Setup MACD Conservative Setup DeMark REI Setup REI Stochastic Setup REI Note 9/30 Setup
REI Additional Note
A period of five or fewer days in the overbought /
oversold zone constitutes a mild reading regardless of the extremity of the
reading: a period of more than five days translates into a severe
indication.
Specifically, markets reverse when modest or mild overbought / oversold
readings are recorded: whenever extreme readings are registered a
"recycling" process must occur. The indicator must move into a neutral zone
and then record a second mild (rather than severe) indicator reading to
signal a reversal.
This dichotomy of severe vs. mild readings is consistent with
divergence analysis and explains why this technique sometimes seems to work:
The initial thrust into overbought / oversold territory is generally severe
(more than five days), and is followed by a move into the neutral zone and a
subsequent milder overbought / oversold reading.
Concurrently momentum often propels price above or below its previous
extreme, and a divergence occurs. When a mild reading is about to move into
a neutral position a price reversal generally takes place.
Through research and experience I have defined an
overbought / oversold band of +45 to -45 for the five day REI that helps
identify impending price changes.
If the indicator remains above or below these levels for more than five
consecutive days (a severe or extreme reading), postpone any trading
activity until the indicator has "recycled" by re-entering the neutral area
between +45 and -45. If it remains above or below the extreme levels five
days or less (a mild reading), prepare for at least a short-term price
reversal.
Qualifiers A simple and conservative
method to confirm a price trend change is to wait for the indicator to
penetrate either the upper or lower indicator band and exit that zone within
a period of five days.
A more aggressive approach is to identify the first daily close greater
than the previous day's close that is in turn preceded one day before by a
price low less than the price low two days earlier, coincident or after an
indicator reading below -45: or conversely, the first daily price close less
than the previous day's price close, which is in turn preceded one day
before by a price high greater than the price high two days earlier
coincident or after an indicator reading > +45.
However, this approach does present the user with an element of risk;
if the indicator remains either below -45 or above +45 for more than five
days, then prudence dictates you should exit the position. Because the first
qualifier technique above is straightforward, I will concentrate on the
second complicated approach.
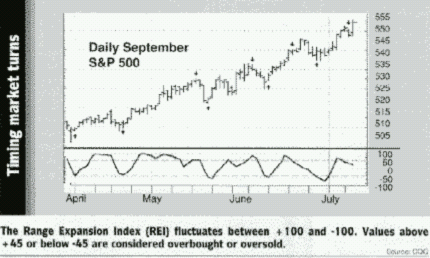
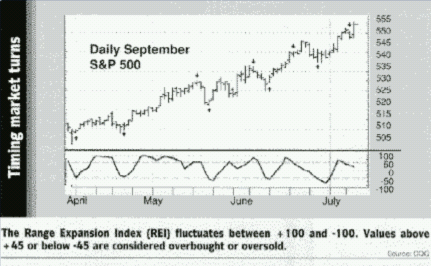
The overbought and oversold zones are highlighted in "Timing market turns" .
The first subsequent up and down closes are identified with arrows, provided
that day is preceded by a price low lower than the previous day's price low
(at a bottom) or price high greater than the previous day's price high (at
the top). In the two instances in which the REI oscillator remained in
overbought territory for more than five days, a failsafe exit appears.
These approaches are objective, mechanical and confront
the nemeses of other commonly used indicators - namely, exponential
distortions caused by random extraneous events, the subjectivity of
divergence analysis, the preoccupation with closing prices, the inclusion of
irrelevant price activity, and the inability to present a formal,
mechanistic analytical approach to identify high- and low-risk entry points.
Through research and experience I have defined an overbought / oversold band
of +45 to -45 for the five day REI that helps identify impending price
changes.
If the indicator remains above or below these levels for more than five
consecutive days (a severe or extreme reading), postpone any trading
activity until the indicator has "recycled" by re-entering the neutral area
between +45 and -45. If it remains above or below the extreme levels five
days or less (a mild reading), prepare for at least a short-term price
reversal.
Explanation provided by Capital West Investment
Group, Inc.
Remember that personally, I trade primarily with the direction of the moving average (MA). This is my first and most important indicator. I use the 30 period weighted moving average, “30WMA”. So I look for sell signals when the MA is pointed down
(Fig. 10), buy signals when the MA is pointed up (Fig. 10). When the MA is basically flat, then the REI signals are oftentimes questionable (Fig. 11). When the MA is flat for an extended time, buy and sell signals can be valid and make for very profitable scalping for the seasoned trader. Choice of Time Frame (TF) is critical