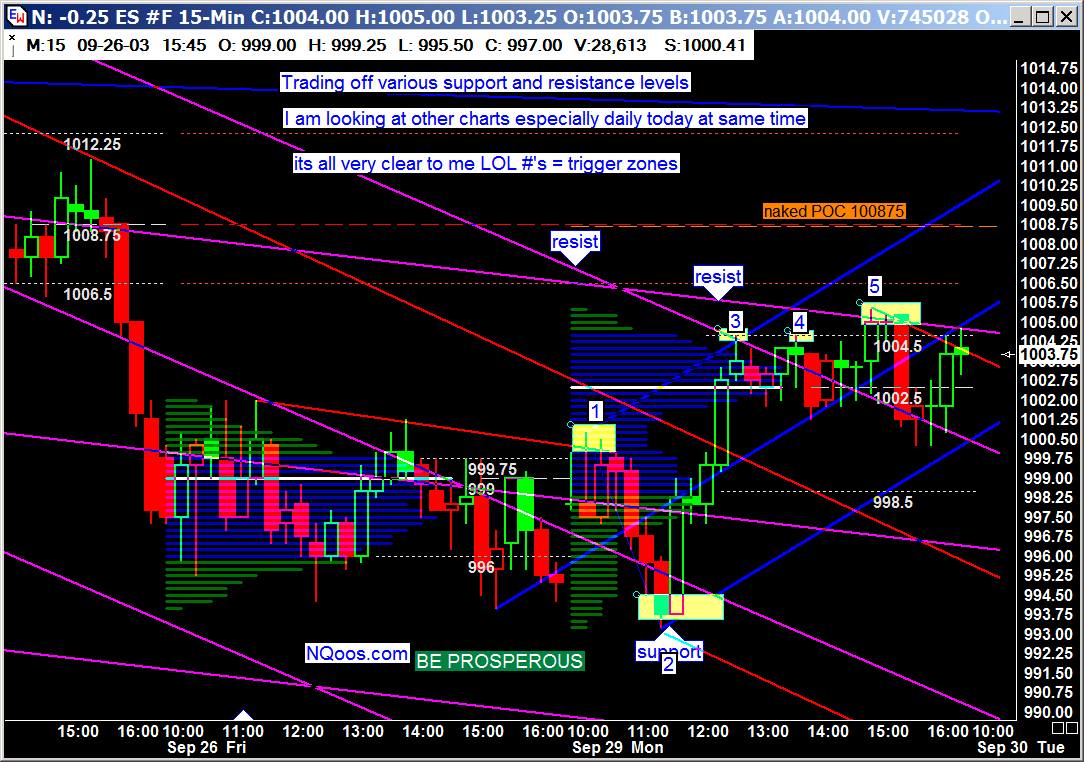
| 092903 ES 15 min
Trading off trendline support and resistance. I am looking at 60
minute and daily at same time.
1= descending tops trendline, 2- target 3rd wave then favorite Andrews first retest setup, 3= retest another Andrews MLH and near wave 4 target, 4 = double top TL, 5 = Andrews MLH and wave 4 target and Daily Andrews MLH. Indicators not required. |
|
 |
|
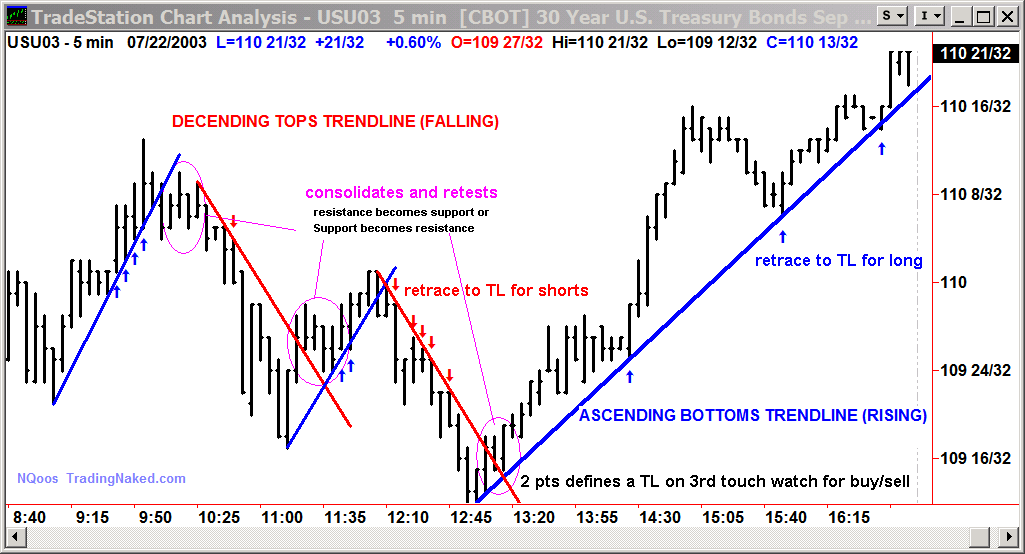
| Bonds Chart 072203 5min
You do not need the low or high of a move to be profitable. Lots of points here after Trendline trend change. Bond again today 2x the $$ daily range of ES. Using the trendline( a few ticks above/below) as a stop with add-ons made for a great day. |
|
|
Ascending Trendlines,
the bottoms that meet the trend line represent bottoms of trends.
This is buying signal.
Descending Trendlines, the retracement tops that meet the trendline represent tops of trends This is selling signal. |
 |
|
|
A penetration from an ascending trend line must be confirmed by one close below the trend line. Conversely, a penetration from a descending trend line should be confirmed by one close above the trend line. Important, volume is the key to determining the significance of the penetration of a trend. Volume increased when the trend line was penetrated. This is an important confirmation that the previous trend is no longer intact. |
| After confirmation, penetrations are likely to be followed by a period of consolidation. Price often retests the TL just broken. It is relatively rare for trends to suddenly reverse direction. | |
| Once a trend line is decisively penetrated, it normally changes its role from one of support to one of resistance for an ascending trend line or resistance to support for a descending trend line | |