E-mini
futures are a phenomenal financial instrument with
which to day trade the stock market. E-minis are transparent,
liquid, and cheap, which is why so many retail traders are
trading them. In this article, I'll detail the characteristics
of the more popular e-minis and show you how to use them with
three simple daytrading approaches.
The Chicago Mercantile Exchange
(CME) introduced mini-sized versions of the S&P 500 and
NASDAQ-100 futures in the late '90s. These mini-sized contracts
were not only smaller in size, tick values, and margin
requirements, they were also traded electronically...and that's
where the term 'e-mini' comes from. But nowadays, with gold,
oil, and other small contracts trading on the screens, the term
'e-mini' is used in trading circles to describe a whole host of
electronically traded contracts.
The S&P 500 (ES) and NASDAQ-100 (NQ) remain among the most
popular e-minis. Also included are the Russell 2000 (ER) and Dow
Jones Industrial Average (YM). The ER e-mini, like the ES and
NQ, trades on the CME, while the YM trades on the
Chicago Board of Trade (CBOT).
These four e-mini contracts, based on the most closely-watched
U.S. equity index averages, are among the most popular choices
for day trading. Other mini futures contracts are catching on,
however, such as the aforementioned gold and oil mini futures.
ES ($50 per point)
The popularity of the indices e-minis stems from the massive
liquidity that is available. The ES routinely trades over 1
million contracts per day during regular trading hours, and a
couple hundred thousand contracts during the overnight session.
To put this into perspective, you can very easily buy or sell
500 ES contracts during the day, which amounts to about
$30,000,000 worth of futures. Trades of 500, even 1000 contracts
clear all day long, without adversely impacting the bid/ask
spread.
Each point in the ES is worth $50, so if you buy one contract at
1280.00 and it goes to 1284.00, you've made $200 ($50 x 4 =
$200). (The 500 lot trader would clear $100,000 on four points!)
The minimum fluctuation of the ES is 0.25 points, which makes
each tick worth $12.50.
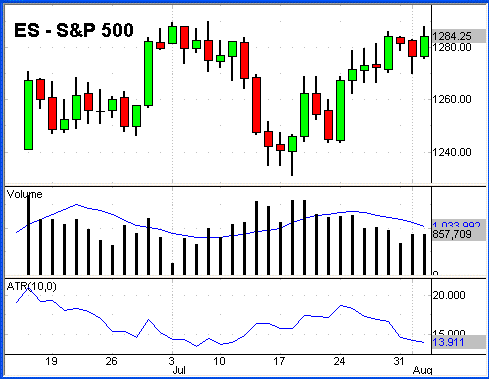
The daily chart below of the ES includes the volume, 10-day
average volume, and the 10-day Average True Range (ATR). I've
included the ATR, which is a basic measure of volatility, to
reveal the dollar potential of the contract. The ATR, although
imperfect, will give us an idea of how much profit potential the
ES is trading with. The way I look at it is like this: The ATR
is at about 14, and each one of those 14 points is worth $50 per
contract, so there's about $700 per contract in dollar movement
going on in the ES.
Source: Quote.com
NQ ($20
Per Point)
The ES is the most popular of the e-minis based on trading
volume. Coming in second is the NQ, which trades about
one-quarter the volume of the ES each day. The NQ is different
in other ways, too, such as its minimum tick value and daily
volatility. Each point in the NQ is worth $20, and like the ES,
the NQ trades in quarter point increments. Each tick in the NQ,
therefore, is worth $5 per contract.
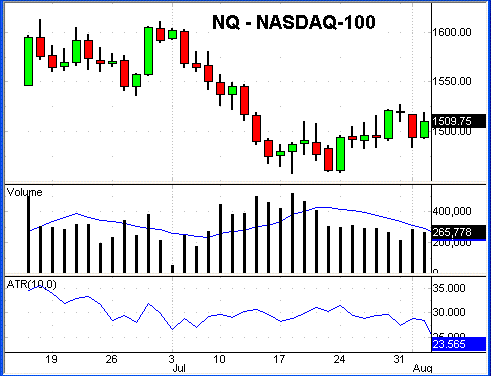
The daily fluctuations of the NQ are much larger than the ES.
Perhaps that stems from the fact that there are 400 fewer stocks
in the underlying index of the NQ, and that most of those
underlying equities are volatile tech stocks. Whatever the
reason, the NQ averages about 25 points per day based on the
10-day ATR. That gives the NQ about $500 (25 x $20) of movement
per day, per contract.
Source: Quote.com
ER ($100
Per Point)
Coming in third place among the equity indices and based
simply on daily volume totals, is the ER. About 150,000
contracts change hands every day. But of the the four indices,
the ER offers the most dollar potential on an intraday basis.
The big movement of the ER and its comparatively high tick
value, are the reasons why I focus primarily on this contract in
my own trading.
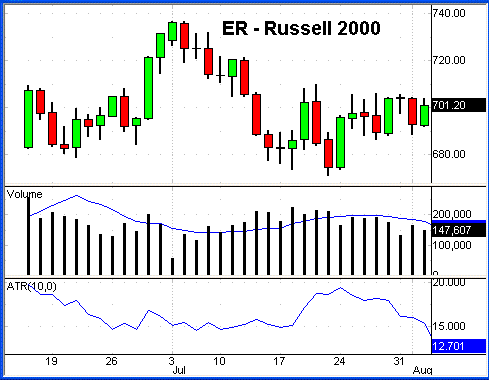
Each point in the ER is worth $100, and the contract trades in
$0.10 increments, so each tick is worth $10 per contract. But
here's where it gets interesting: The 10-day ATR is about 13;
therefore, each day there's about $1300 of profit potential
($100 x 13). The profit potential in the ER dwarfs that
available in the ES and NQ. But with that increased volatility
comes greater risk. That's why the ER is probably not the best
contract to start day trading with, especially for beginners new
to the futures market. The slower moving contracts like the ES
or NQ are better places to begin learning how to day trade with
e-mini futures.
Source: Quote.com
YM ($5
Per Point)
The fourth and final equity index e-mini that we'll take a
look at is the YM, based on Dow Jones Industrial Average. The YM
trades about 100,000 contracts per day, making it the least
popular of the four contracts. I don't know exactly why the YM
hasn't caught on more with traders. After all, it's based on the
Dow, which is much more visible and popular than the Russell
2000, for example. Perhaps the lower trading volume is a
reflection of traders' preference for the CME's trading
platform, Globex, over that of the CBOT's electronic equivalent.
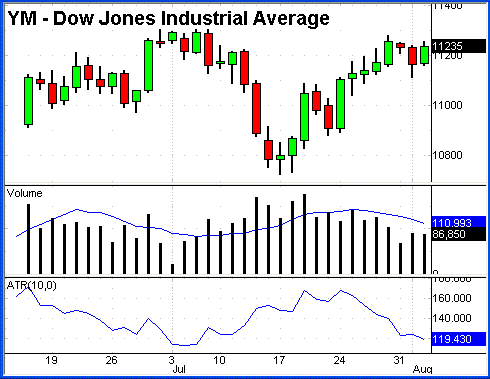
Each point in the YM is worth $5, and the contract trades in
one-point increments. If you bought one contract at 11225 and
sold it at 11235, you would net ten points and make $50 ($5 x
10). The 10-day ATR for the YM is at 119, giving the contract
about $600 of potential each day. As you can see, the dollar
volatility of the YM is similar to the figures for the ES and
NQ.
To learn more about the contract specifications for the YM,
including margin requirements, you can visit the
YM product overview on the CBOT's web site. If you explore
the CBOT site, you will find an extensive listing of other
futures contracts, including several different Dow Jones
Industrial contracts that are worth $10 and $25 per point.
Source: Quote.com
The reason that I've gone through
explaining the different characteristics of each equity index
e-mini is to help you decide which contract best fits with your
trading style, risk tolerance, and account equity. But you don't
necessarily have to choose one contract and only trade it. The
argument for trading all four equity index e-minis is that from
day to day, one will be over- or under-performing the others.
I'm sure you've noticed that on some days small caps out perform
large caps, which would make the ER a better buy than the YM on
that particular day. This phenomenon is referred to as relative
strength, and it plays out every day in the market. If the day
has an overall upward bias, it would make sense to buy the
e-mini that is trading the strongest. Conversely, if the overall
trend of the day is downward, then it would make the most sense
to short the contract that is trading the weakest.
If you are going to monitor and trade all four equity index
e-minis, then you can follow a few simple steps each day when
deciding on which contract to trade.
1. Define the day's trend.
This can be done through casual observation such as
assessing the day's change from yesterday's close, or
defined with indicators or quantitative analysis. However
you do it, define the trend of the day as up or down.
2. Buy the contract that is trading the strongest, i.e.
biggest percentage gain for the day, if the market is in an
upward trend.
3. Sell the contract that is trading the weakest, i.e.
biggest percent loss for the day, if the market is in a
downward trend.
4. Cut losses short with a technically-based stop loss
in the event that the day's trend reverses.
5. Let profits run.
Monitoring all four contracts
does require more attention and possibly additional technology
resources such as multiple monitors. But daytrading the e-minis
can be made simpler by following just one of the contracts. As I
wrote earlier, I primarily trade the ER because, dollar for
dollar, it has the biggest swings of the four futures. But that
may not make the ER right for you, especially if you're just
getting started with trading the e-minis. One of the slower
moving contracts, in fact, might be a better choice for
beginners. Further, I'm not trading with a multi-million dollar
account, so I can afford to be a little more nimble with my
entries and exits; I don't need the liquidity of the ES or NQ. I
can move 20 contracts in the ER pretty easily, without adversely
impacting the bid and ask. If I were trading 100 or 200
contracts at a time, however, then I would instead use the ES or
NQ.
Day Trading The E-minis
It doesn't matter if you're trading one lot or 500 contracts
at a time. It doesn't matter if you're focusing on the ER, or
trading all four e-minis every day. Successful day trading can
be reduced to one simple truth: following the day's trend. You
can put yourself ahead of the competition and far along the
learning curve by accepting the fact that market's trend, and
within those trends is the potential for profit. It's cliché, I
know, but too many day traders try to fight it. They try to go
against the trend by looking for tops and bottoms, going against
the tide for the day. The trend fighters will eventually find
themselves on the top of a pile of traders who were forced into
premature retirement because they lost it all. You can stay off
that heap of busted traders by going with the flow of the day,
and sticking with the trend.
Sure, the trend can change on an intraday basis. It does all of
the time. And when you observe such a change, you can adapt, be
flexible, and go with the new trend. But trying to time when the
day's trend is going to end will eventually lead to financial
ruin. The bottom line: trade with the intraday trend.
Of course, defining the trend is where we move away from the
theory and into practical application. There are three ways that
I like to define the trend of the day: using support and
resistance; observing higher highs and lows or lower highs and
lows; applying technical indicators. You can use one of these
three approaches on a standalone basis, or you can combine all
three into a comprehensive approach to day trading the e-minis.
Support And Resistance: Daily Pivot
Points
My preferred way of applying support and resistance
techniques to day trading the e-minis is through the use of
daily pivot points. I apply common techniques around the pivot
points, such as buying bounces off of support in an upward trend
or buying breakouts above resistance. In downward trends, I look
to short on breaks below support or upon rollovers from
resistance. It's that simple.
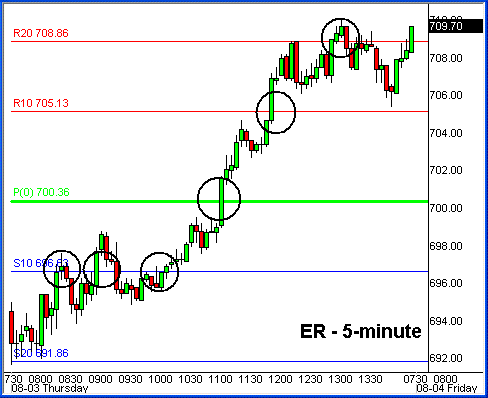
I've pulled an example of a trend day to show how the pivot
points can help to gauge the strength of the day's trend, and
offer entry points into such a move. The example that I'm using
is of a flat-out trend day, one during which fortunes can be
made by simply going with the flow of the day. I've used the ER
to demonstrate how simply buying breakouts above intraday
resistance can put you in the position to profit.
Source: Quote.com
There were three false breakouts
during this day that probably would have resulted in small
losses. Two false starts near the start of the session, and one
false start late in the day. But there were three other
breakouts that would have put you in the position for about 13
points of profit, or $1300 per contract, from 697.00 to 610.00.
All by simply following the trend.
Higher Highs/Lower Lows
Observing higher highs and lows is an easy way to define an
upward trend, while looking for lower lows and highs is a simple
way of defining a downward trend. The key is to keep your
observations to one time frame, and not use multiple timeframe
analysis. Scanning multiple timeframes, looking for higher highs
or lower lows, will only confuse you. If you're going to use
this method, just stick with one timeframe, which brings up an
interesting question about what timeframe you should use.
I've seen day traders in the e-minis use hourly intervals all
the way down to ticks. Generally the shorter the interval, the
smaller the trend, and the greater the transaction costs. I
think it's wise to find a happy medium when considering what
timeframe you will trade. Usually somewhere between the 2- and
10-minute intervals will serve you well.
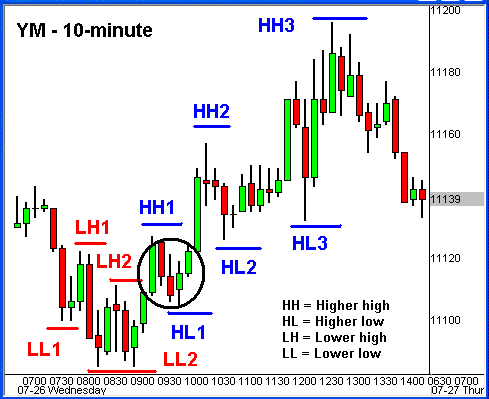
For illustrating this strategy, I've used a 10-minute chart of
the YM. On this particular day, you will see an early downward
trend, and then a change in trend, which led to more than 100
points from low to high.
Source: Quote.com
The YM changed its direction
after observing the formation of HH1 and HL1. We only know this
with the benefit of hindsight, after these lows formed. But
after HL1 formed, and the YM surpassed HH1, you could have
pulled the trigger on long position since the contract was on
its way to a higher high. If you missed that move, then a new
bullish entry anywhere remotely close to HL2, with a stop placed
below HL1, would have most likely resulted in a good profit as
the YM moved up another 60 points towards HH3.
Looking for higher highs and lows in the case of an upward trend
takes patience. Truthfully, I usually wait out the first hour of
trading before applying this method. The same holds true for a
downward trend, when looking for lower lows and highs. But this
can be a great way to define the day's trend, or determine when
the trend has changed. Further, you can use previous highs and
lows as stop levels.
Systematic Trading With Indicators
The third way that I define the trend of the day is through
the use of technical indicators. These tools could be applied on
a standalone basis, such as buying and selling crossovers in the
MACD, or trading reversal zones in the RSI, or using the slop of
moving averages to define the trend of the day. But I like to
combine a few simple technical indicators to come up with a
systematic approach to trading the e-minis.
Here's a combination of two of my favorite indicators,
stochastics and moving averages, and the rules that make up a
daytrading system:
1. The system can be applied
to a 1-minute chart up to a 10-minute chart.
2. The trend is defined by the relationship of two moving
averages: 5- and 25-period simple moving averages (SMA). The
trend is up if the 5 is above the 25, and the trend is down
if the 5 is below the 25. (You can experiment with any
combination of moving averages.)
3. The stochastic gives buy and sell signals when %K crosses
%D. A buy signal is generated when %K crosses up through %D,
and a sell signal is generated when %K crosses down below
%D.
4. Take buy signals from stochastics only in an upward
trend, as defined by the moving averages. Take sell signals
only in a downward trend, as defined by the moving averages.
5. Exit a long when the 5 crosses below the 25. Exit a short
when the 5 crosses above the 25.
That's it, a very simple system
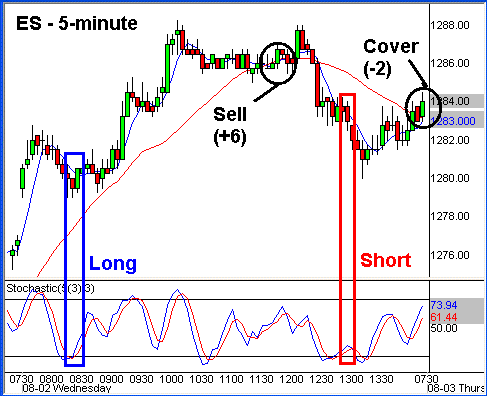
that you can use the day trade the e-minis. Here's an example of
the system applied to the ES at a 5-minute interval.
Source: Quote.com
As you can see from this one day
example, the trading system is not perfect. There's no such
thing as the perfect trading system. But the system does put you
in the position for big intraday trends, such as the six point
move on the above chart in the ES. It's a trend-following
system, which fits well with the support and resistance, and the
higher highs and lows approaches.
Conclusion
The equity index e-minis attract some of the best traders in
the market because there is so much opportunity to make a lot of
money. The volatility and high degree of leverage are a powerful
mix that can add up to big money. Just the same, these two
components can cause for quick losses and the destruction of a
trading account. That's why risk management is of the utmost
importance when trading the e-minis. You must take into
consideration your account equity and, by extension, your
position size, and the risk that you're willing to assume per
trade. Put another way, you have to absolutely manage risk.
A step towards better risk management is trading with the
direction of the trend. You'll increase your odds of success and
put yourself in the position to capture profits while minimizing
risk. You can use one of the methods that I've shown you on a
standalone basis, or combine two or more strategies. But however
you choose to trade the e-mini market, make sure you point your
trades in the direction of the trend.


