Open a Chart
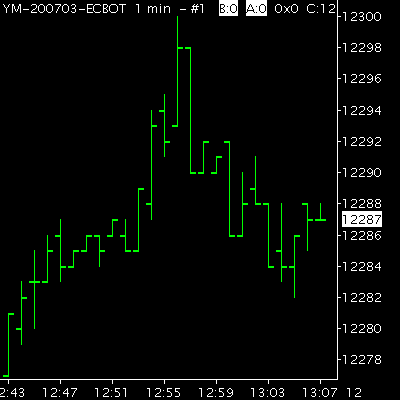
Open a 1 minute OHLC (Open, High, Low, and Close) bar chart.
Open a Chart
|
Zero Line Cross
Introduction
The zero line cross trade uses a short term timeframe, with two
long term CCI, and a single exponential moving average. The
trade is based upon the CCI crossing over the zero line, while
the price is on the correct side of the moving average.
The CCI displays the momentum of the price as a value either above or below zero. When the CCI is above the zero line, the price has upwards momentum, and when the CCI is below the zero line, the price has downwards momentum. When the CCI is crossing the zero line, the momentum is switching from one direction to the other. The zero line cross trading system use this change of direction as its entry point, and uses the price in relation to the moving average as a direction confirmation. The default trade uses a 1 minute OHLC (Open, High, Low, and Close) bar chart, a 50 bar CCI, a 25 bar CCI, and a 34 bar exponential moving average. The default trading time is any time that the market is open and active, such as the European morning for European markets, and the US morning for both US and European markets.The following step by step tutorial of the zero line cross trade, will use the YM futures market, but exactly the same steps should be used on whichever markets you are trading with this trade. The trade used in the tutorial is a short trade, using 1 contract, with a target of 20 ticks, and a stop loss of 10 ticks. The stop loss is only used as a last resort, as the zero line cross trade includes an exit signal that should exit the trade before the stop loss is reached. |
Open a Chart
Open a 1 minute OHLC (Open, High, Low, and Close) bar chart.
Open a Chart
|
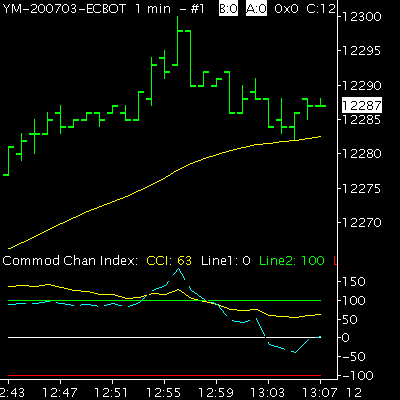
Add the CCI, and an Exponential Moving Average
Add a 50 bar CCI, a 25 bar CCI, and a 34 bar exponential moving
average of the HLC typical price (calculated as (High + Low +
Close) / 3)).
Add the CCI, and an Exponential Moving Average
|
Watch the Market
Watch the market, and wait until the market is active and moving
decisively.
Watch the Market
|
Wait for the Zero Line Cross
Wait until the 50 bar CCI crosses the zero line, while the 25
bar CCI is on the correct side of the zero line, and the price
is on the correct side of the moving average.
This means that if the 50 bar CCI crosses above the zero line, the 25 bar CCI should also be above the zero line, and the price should close above the moving average, and vice versa if the 50 bar CCI crosses below the zero line. If either the 25 bar CCI is on the wrong side of the zero line, or the price is on the wrong side of the moving average (i.e. CCI crosses above, while price closes below the moving average), the trade has not met its requirements, and should not be entered. 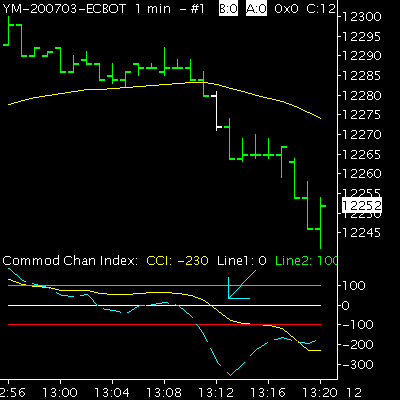
Wait for the Zero Line Cross
|
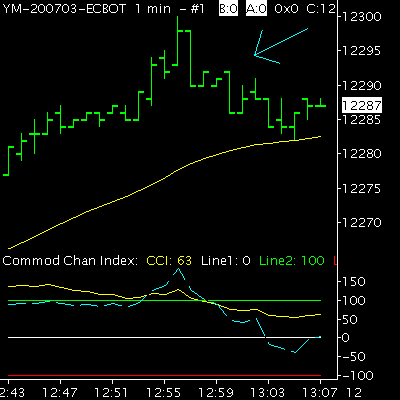
Enter your Trade
Enter your trade when the high (or low) of the entry bar (the
bar when the 50 bar CCI crossed the zero line) is broken by a
subsequent bar. There is no default order type for the zero line
cross trade entry, but for the YM the recommendation is a limit
order.
As soon as your entry order has been filled, make sure that your trading software has placed your target and stop loss orders, or place them manually if necessary. There is no default order type for either the target or stop loss, but for the YM (and usually for all markets), the recommendation is a limit order for the target, and a stop order for the stop loss. In the trade shown on the charts, the entry bar is shown is white, and the entry is when the subsequent bar breaks the low of the entry bar, which is at 12270, with a target of 12250, and a stop loss of 12280.
Enter your Trade
|
Watch for the Exit Signal
In addition to the target and stop loss orders, the zero line
cross trade includes an exit and reverse signal. If an entry in
the opposite direction is signaled, before either the target or
stop loss orders have been filled, the trade should be exited
and reversed.
For example, if the original trade was a long trade, then the new trade would be a short trade, and vice versa. If a new trade is entered, you should make sure that any pending orders from the previous trade have been cancelled, and that new exit orders are placed, either manually, or automatically by your trading software. A trade that is exited because of an exit signal can be either a winning trade or a losing trade, depending upon the price at the exit. There are a number of other possible exit signals, including the 50 bar CCI crossing back over the zero line (without signaling a new entry), the price crossing back over the moving average, or the low (or high) of the entry bar being broken. The exit signal that works the best will depend upon the market being traded, and therefore should be adjusted accordingly. |
Wait for your Trade to Exit
If the exit signal does not happen, wait for the price to trade
at your target or at your stop loss, and for either your target
or stop loss order to get filled. The zero line cross trade can
take anywhere from a few minutes to a couple of hours to reach
its target or stop loss. The trade does not use any target
adjustments, and the only stop loss adjustment would be moving
the stop loss to break even at a suitable time.
The targets that are shown on the chart are at 12265 (5 ticks), 12260 (10 ticks), and 12250 (20 ticks), all of which were filled by this trade. If your target order has been filled, then your trade has been a winning trade. If your stop loss order has been filled, then your trade has been a losing trade. 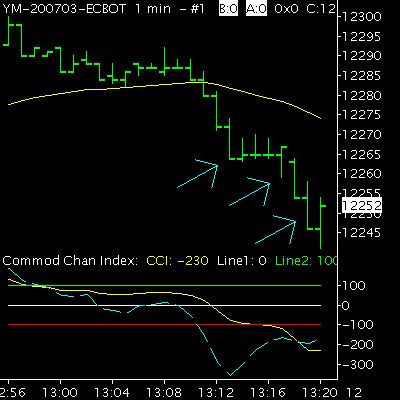
Wait for your Trade to Exit
|
Repeat the Trade
Repeat the trade from step # 5, as many times as necessary,
until your daily profit target has been reached, or until your
market is no longer active, or no longer moving decisively.
|
Trading Reports
The zero line cross trade will be reported in the blog. You can
use these trading reports to follow the zero line cross trade,
and also to compare it to your own trading.
If you have any questions about the zero line cross trade, or would like to see additional charts of the trade, leave a comment in the blog, and I will be glad to provide additional information. |