| Ultimate Oscillator |
| Introduction |
Developed by Larry Williams and first described in a 1985 article for Technical Analysis of Stocks and Commodities magazine, the "Ultimate" Oscillator combines a stock's price action during three different time frames into one bounded oscillator. Values range from 0 to 100 with 50 as the center line. Oversold territory exists below 30 and overbought territory extends from 70 to 100.
Three time frames are used by the Ultimate Oscillator and can be specified by the user. Typically values of 7-periods, 14-periods and 28-periods are used. Note that these time periods all overlap, i.e. the 28-period time frame includes both the 14-period time frame and the 7-period time frame. This means that the action of the shortest time frame is included in the calculation three times and has a magnified impact on the results.
| Calculation |
- Calculate Today's "True Low (TL)". TL = the lower of today's low or yesterday's close.
- Calculate Today's "Buying Pressure (BP)". BP = Today's close - Today's TL.
- Calculate Today's "True Range (TR)". TR = the higher of 1.) Today's High - Today's Low; 2.) Today's High - Yesterday's Close; 3.) Yesterday's Close - Today's Low.
- Calculate BPSum1, BPSum2, and BPSum3 by adding up all of the BPs for each of the three specified time frames.
- Calculate TRSum1, TRSum2, and TRSum3 by adding up all of the TRs for each of the three specified time frames.
- The Raw Ultimate Oscillator (RawUO) is equal to:
4 * (BPSum1 / TRSum1) + 2 * (BPSum2 / TRSum2) + (BPSum3 / TRSum3)
- The Final Ultimate Oscillator is equal to:
( RawUO / (4 + 2 + 1) ) * 100
Note: The '*' sign in the above formula denotes
multiplication.
| Use |
The Ultimate Oscillator can be used on intraday, daily, weekly or monthly data. The timeframe and number of periods used can vary according to desired sensitivity and the characteristics of the individual security.
It is important to remember that overbought does not necessarily imply time to sell and oversold does not necessarily imply time to buy. A security can be in a downtrend, become oversold and remain oversold as the price continues to trend lower. Once a security becomes overbought or oversold, traders should wait for a signal that a price reversal has occurred. One method might be to wait for the oscillator to cross above or below -50 for confirmation. Price reversal confirmation can also be accomplished by using other indicators or aspects of technical analysis in conjunction with the Ultimate oscillator.
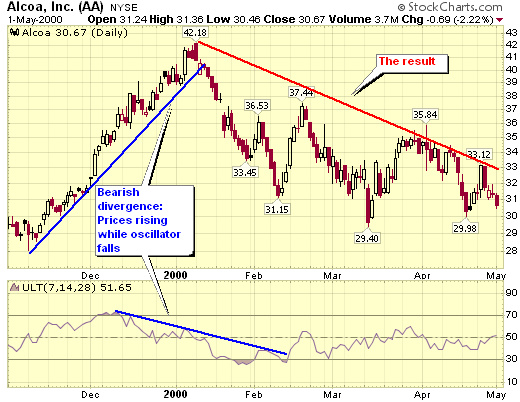
| Example |
This chart of Alcoa (AA) with the Ultimate Oscillator illustrates some key points: