| Swing Charting |
What do Point & Figure charts, Kagi charts, Renko charts, Filtered Waves, and Zig Zag have in common? They are all related to swing charting in some way. Swing charting follows a simple concept: additional information to the chart is made when a new price swing penetrates the level of the prior swing in the same direction. The basis of this type of charting is the filter. Once prices have moved by the distance specified by this filter, a new line is drawn next to the previous one. In a nutshell, it is a chart that shows up and down price movement of a minimum size regardless of the time it takes.
Another concept of swing charts is that it works similarly to a breakout system. A new high made after so many days is a buy signal and a sell signal occurs when a new low is made after so many days. This has been written about for years, by Gann, Merrill, Livermore, Donchian, Hochheimer, Wilder, and Keltner, to name a few. They all used some form of swing charting.
Many swing based systems use volatility as the basis for determining the parameters to use for determining the swing filter. This way, as the current volatility increases, the number of days used in the calculation of the swing filter decreases.
On of the more simple swing systems was Donchian's Four-Week Rule. Buy when the current price goes above the highs of the previous 4 full weeks. Sell (go short) when the price falls below the lows of the previous 4 full weeks. That's it. Guess what? In 1970, Dunn and Hargitt Financial Services rated it as the best of the popular systems of the day.
There are a host of different swing charting techniques. Some use 3 consecutive new highs as an up move and will remain as such until 3 consecutive new lows. The list is endless, but the concept is the same.
Arthur Merrill first wrote about filtered waves in his book, “Filtered Waves” in 1977. His swing filter was merely a percentage of price movement. This technique removes actual price from the decision and can work on just about any time series. For all you engineers, it is just an amplitude filter; it helps remove undesirable information.
Zig-Zag is the term used by many charting programs, including StockCharts.com, for this filtered wave type of charting.
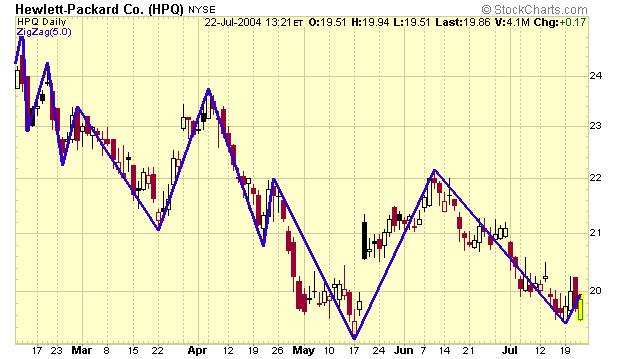
One simple example is to display price data identifying only moves of 5% or greater.
One can see that it filters out all the small price variations and only shows the moves of 5% or greater.
IMPORTANT: One caveat however, the last leg of Zig Zag is going to change as the most recent price changes until prices are reversed by the filter amount (5% in the above chart). The important item is the turning point, which is the point at which prices have reached at least the filter amount since they reversed. If you see a turning point, then prices have already moved at least the filtered amount in the opposite direction. Please read this paragraph again.
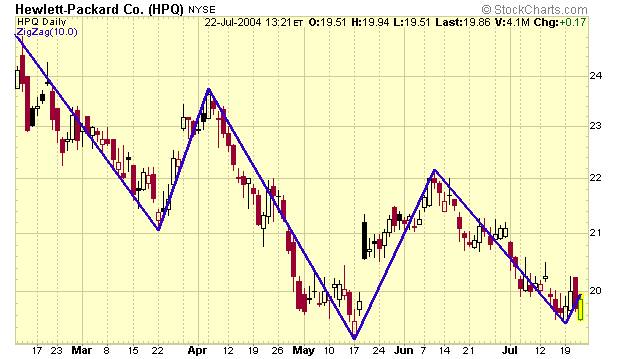
Below is the same price data but with a 10% filter being used. Notice how it removed some of the smaller waves.
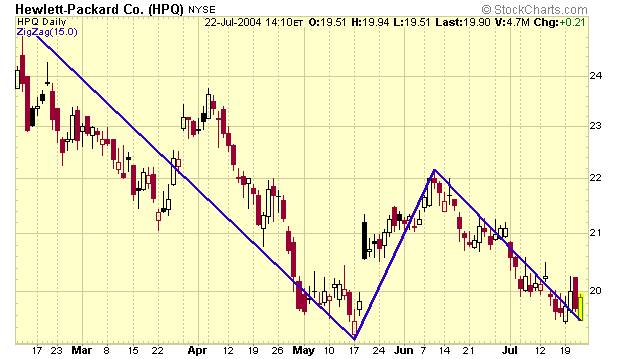
Below is a chart using the exact same data, but with a filter of 15%. That is, only moves of 15% or greater are shown by Zig Zag. Notice that the small upmove in the last few days of the previous charts is gone. This is because prices have not moved upward by 15% since the down leg started.
Swing charting is a viable tool for trading and making investment decisions. It covers all the basics: