| StochRSI |
| Introduction |
Developed by Tushard Chande and Stanley Kroll, StochRSI is an oscillator that measures the level of RSI relative to its range, over a set period of time. The indicator uses RSI as the foundation and applies to it the formula behind Stochastics. The result is an oscillator that fluctuates between 0 and 1.
In their 1994 book, The New Technical Trader, Chande and Kroll explain that RSI sometimes trades between 80 and 20 for extended periods without reaching overbought and oversold levels. Traders looking to enter a stock based on an overbought or oversold reading in RSI might find themselves continuously on the sidelines. To increase the sensitivity and provide a method for identifying overbought and oversold levels in RSI, Chande and Kroll developed StochRSI.
Developed by Welles Wilder, RSI is a momentum oscillator that compares the magnitude of gains to the magnitude of losses over a period of time. Developed by George Lane, Stochastics is a momentum oscillator that compares the closing level to the high/low range over a given period of time.
| Calculation |
From the formula above, it can be seen that StochRSI is the Stochastics formula applied to RSI; that is, it's an indicator of RSI. StochRSI measures the value of RSI relative to its high/low range over a set number of periods. When RSI records a new low for the period, StochRSI will be at 0. When RSI records a new high for the period, StochRSI will be at 100. A reading of .20 would mean that the current RSI was 20% above the lowest level of the period, or 80% below the highest level. A reading of .80 would mean that the current RSI was 80% above the lowest level of the period, or 20% below the highest level.
| Signals |
| Example |
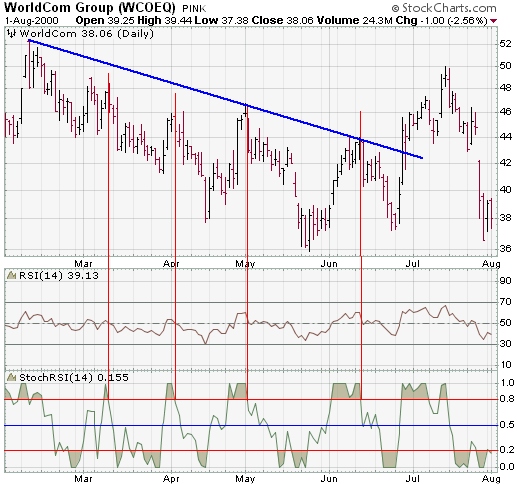
In the WCOM example above, the stock peaked in Jun-99 and was in a well-established downtrend. A series of lower lows and lower highs confirmed the primary trend as bearish. According to Chande and Kroll, these conditions would best suit StochRSI for identifying overbought levels from which to short the stock. Each time StochRSI advances above .80, an overbought situation would occur. When the indicator declined from its overbought level back below .80, a sell signal would have been given.
From March to June, the indicator gave 4 sell signals, or one per month. The July sell signal was not recognized because there was a possible change in trend. As long as the series of lower highs and lower lows continued, the downtrend remained intact. A higher low in late June was followed by a higher high in July to call into question the strength and validity of the downtrend. Once the higher high arrived, the signals for StochRSI may have required adjustments to protect against whipsaws.
Trying to buy the stock on advances from oversold levels back above .20 would have proved difficult. There were whipsaws in March and May that would have resulted in some bad trades. This choppy action around .20 could have also led to some premature exits from profitable short positions. When a stock is trending lower, it is sometimes prudent to raise the level in order to close short positions (or to generate buy signals). In this case, a trader could have required StochRSI to move from oversold to above .50 before closing short positions. This would have eliminated the March and May whipsaws.