| The Pre-Holiday Effect |
Over the past century, there have been nine holidays during which the Exchanges have traditionally been closed. Historical research shows that stock prices often behave in a specific manner in each of the two trading days preceding these holidays. By becoming aware of this behavior, both short-term traders and longer-term investors can benefit.
The general strategy is to purchase equities one or two days prior to a holiday. Short-term traders would look to sell just after the holiday while longer-term investors would wait until year end. Both strategies have proven to be profitable plays. The theory behind this effect is that traders are lightening up their holdings (selling) prior to the three day holiday in order to avoid any unexpected bad news. The selling pressure drives stock prices down, making those days a good opportunity for buying lower in the range.
Here is the average pre-holiday results for the last 50 years, based on the S&P 500 Index:
| Holiday |
Buy two days before, sell at year end |
Buy one day before, sell at year end |
| President's Day* | -0.1% | 12.2% |
| Good Friday | 7.3% | 17.8% |
| Memorial Day | -4.7% | 22.8% |
| Independence Day | 13.3% | 37.3% |
| Labor Day | 16.8% | 33.7% |
| Election Day | 17.9% | 4.6% |
| Thanksgiving | 4.3% | 1.1% |
| Christmas | -7.1% | 15.2% |
| New Year's | 31.1% | 19.6% |
*Note: President's Day data is comprised of the aggregate of both Washington and Lincoln's Birthday prior to 1998.
The original research was based on the behavior of the S&P 500 Index around the 419 holiday market closings that occurred from 1928 to 1975.
To put those returns in perspective, if you had invested $10,000 in the S&P 500 Index in January 1928 and sold it all in December 1975, you would have ended up with $51,441. However, if you had invested one-ninth of your money just before each pre-holiday period (selling everything at the end of the year), you would have finished with $1,440,716. Not bad!
The Short Term Trading Strategy
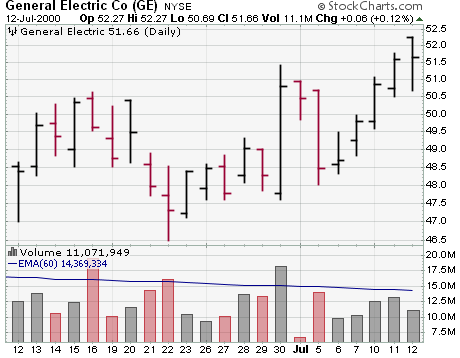
Short term trading using the this pre-holiday effect can provide excellent
results. In the chart for GE, below, we see that a buy near open on June 30th
would be accomplished around $47.75. Selling at open on July 5th at $50.25
provided excellent returns.
It is important to note that there are two holidays which often have a partial trading day during the holiday weekend - the day before Independence Day and the day after Thanksgiving. These days usually have a shorten trading session that can be extremely volatile. While they can be traded, volume is always very light and it may be difficult to get limit orders filled.
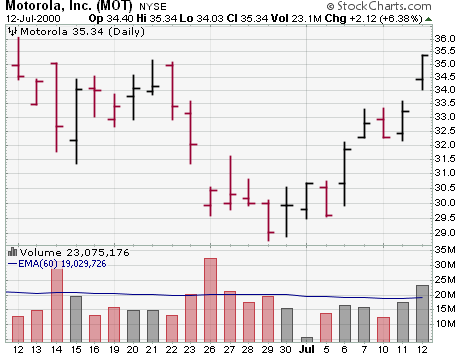
In the chart below for Motorola (MOT), we can see that a buy at $30 on June 30th would have been a flat trade July 3rd, but rose $2 and $3 a share in the two days following the July 4th holiday.
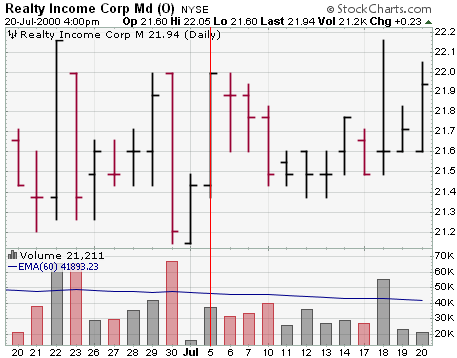
For Realty Income, we have a buy near close at $21.2, and a sell just after the open on July 5th at $22. The volume is less than 50,000 shares on average, and the stock is generally downtrending, but the method is still viable.
The Long Term Trading Strategy
Again, the theory says that stocks generally fall on those days because traders
offload their holdings in order to avoid the risk of significant news appearing
while the markets are closed. Longer-term investors who are willing to ride out
any short-term negative news are rewarded with lower entry prices.
Here are four examples from the 2000 Memorial Day holiday (May 26th) where excellent entry points appeared:

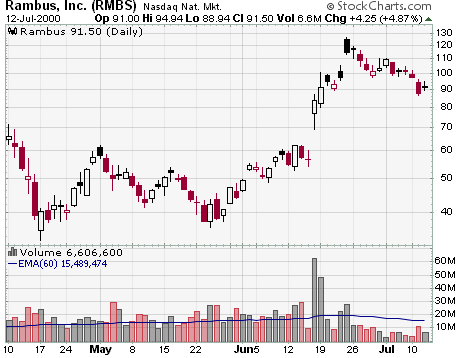
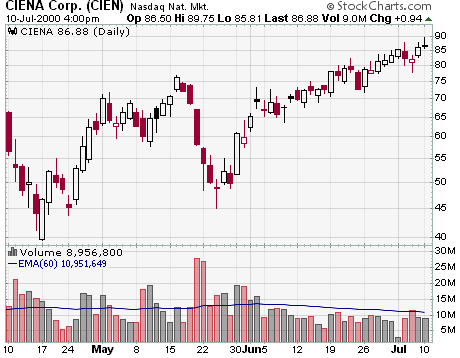
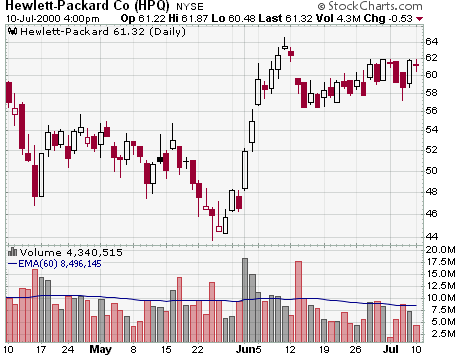
Investors that took advantage of those dips should be rewarded by year end.