
| Percentage Volume Oscillator (PVO) |
| Introduction and Calculation |
The Percentage Volume Oscillator (PVO) is the percentage difference between two moving averages of volume. The indicator is calculated with the following formula:
Volume Oscillator (%) - PVO = ((Vol 12-day EMA - Vol 26-day EMA)/Vol 12-day EMA) x 100
The 12-day exponential moving average (EMA) and 26-exponential moving average were used as examples. Typically, these can be changed to suit longer or shorter time periods. Because of its formula, the PVO has a maximum value of +100, but no minimum value. For example: if the 12-day EMA equals 2000 and the 26-day EMA equals 8000, then the PVO would equal -300 (((2000 - 8000)/2000) x 100) = -300. The absolute value is not as important as the direction or the crosses above and below the zero line.
| Uses |
The PVO can be used to identify periods of expanding or contracting volume in
three different ways:
Movements in the PVO are completely separate from price movements. As such, movements in PVO can correlated with price movements to assess the degree of buying or selling pressure. Advances combined with strength in the PVO would be considered strong. Should the PVO decline while a security's price fell, it would indicate decreasing volume on the decline.
| Examples |
In the example above, FILE is shown with two PVO settings: PVO (12,26,9) in the top window and PVO (5,60,1) in the bottom window. When the final variable is set at 1, as with PVO(5,60,1) there is no signal line or histogram. During August and September, the stock traded between 15 and 21, and the PVO remained mostly below zero. There was a small bounce above zero with the late August advance, but the stock remained confined to its trading range. When the stock began to advance off of its low in October, the PVO moved into positive territory with a sharp rise (green line). The advance was confirmed with expanding volume and the stock broke resistance. The breakout with expanding volume signaled exceptionally strong buying pressure.
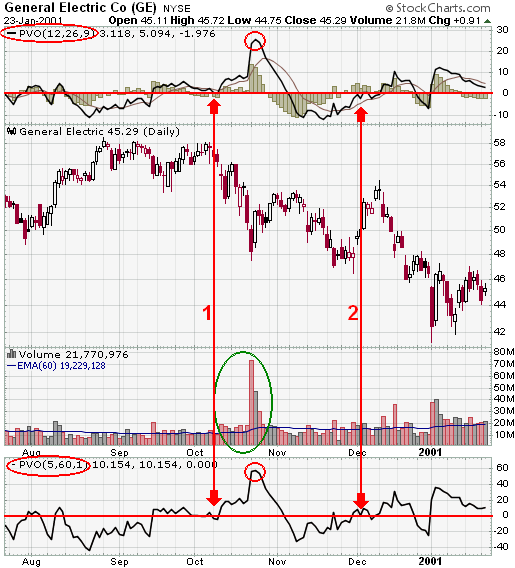
In the example above, the PVO is set in the top window at the default setting (12,26,9) and in the bottom window at (5,60,1). Even though the line shapes for both PVO settings are almost identical, the scales on the right reflect different ranges and crossover points.
Much of this difference can be attributed to the short EMA of volume in both PVO settings. The 5-day EMA of volume is much more sensitive than the 12-day EMA of volume. Shorter moving averages are more volatile and more likely to have centerline crossovers. Above-average volume periods can also be confirmed by watching for volume bars that exceed the 60-day EMA (green oval in October). Notice that both PVOs shot up in the second half of October as volume spiked above 60m shares.