| Money Flow Index (MFI) |
| Introduction |
The Money Flow Index (MFI) is a momentum indicator that is similar to the
Relative Strength Index (RSI) in both interpretation and calculation. However,
MFI is a more rigid indicator in that it is volume-weighted, and is therefore a
good measure of the strength of money flowing in and out of a security. It
compares "positive money flow" to "negative money flow" to create an indicator
that can be compared to price in order to identify the strength or weakness of a
trend. Like the RSI, the MFI is measured on a 0 - 100 scale and is often
calculated using a 14 day period.
| Formula |
The "flow" of money is the product of price and volume and shows the demand for
a security and a certain price. The money flow is not the same as the Money Flow
Index but rather is a component of calculating it. So when calculating the money
flow, we first need to find the average price for a period. Since we are often
looking at a 14-day period, we will calculate the typical price for a day and
use that to create a 14-day average.
![]()
Money Flow = (Typical Price) x (Volume)
The MFI compares the ratio of "positive" money flow and "negative" money flow.
If typical price today is greater than yesterday, it is considered positive
money. For a 14-day average, the sum of all positive money for those 14 days is
the positive money flow. The MFI is based on the ratio of positive/negative
money flow (Money Ratio).
![]()
Finally, the MFI can be calculated using this ratio:
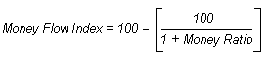
The fewer number of days used to calculate the MFI,
the more volatile it will be.
| Use |
The MFI can be interpreted much like the RSI in that it can signal divergences
and overbought/oversold conditions.
Divergences: Positive and negative divergences between the stock and the MFI can
be used as buy and sell signals respectively, for they often indicate the
imminent reversal of a trend. If the stock price is falling, but positive money
flow tends to be greater than negative money flow, then there is more volume
associated with daily price rises than with the price drops. This suggests a
weak downtrend that threatens to reverse as money flowing into the security is
"stronger" than money flowing out of it.
Overbought/Oversold: As with the RSI, the MFI can be used to determine if there
is too much or too little volume associated with a security. A stock is
considered "overbought" if the MFI indicator reaches 80 and above (a bearish
reading). On the other end of the spectrum, a bullish reading of 20 and below
suggests a stock is "oversold".
| Examples |
PeopleSoft
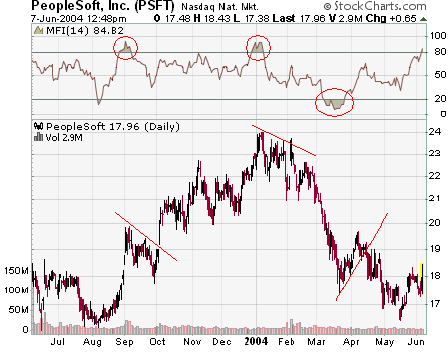
The PeopleSoft example shows how the MFI is a useful indicator of market tops and bottoms. Overbought conditions in September and January resulted in reversals of uptrends, and the oversold condition in March resulted in a reversal of the prior downtrend.
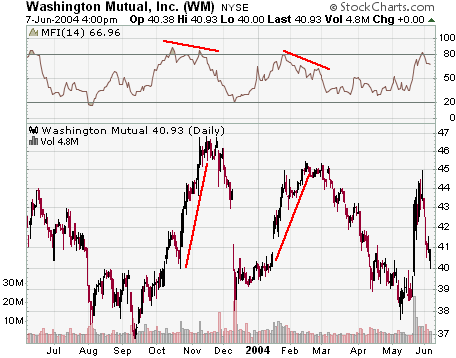
The Washington Mutual example shows how the MFI can also be used to anticipate imminent reversals. If prices are trending upwards and the MFI is trending downwards, reversals such as those December and March may occur. However, divergences between price and MFI can exist for long periods of time. Therefore, as with all indicators, the MFI should be used in tandem with other indicators that can provide confirmation of any signals it sends.