
|
Chaikin Money Flow Part 2 Part 1 | Part 2 |
| Distribution Indications |
The Chaikin Money Flow oscillator generates bearish signals by indicating that a security is experiencing selling pressure, or is perhaps under distribution. As with the bullish signals, there are three items used to determine whether or not a security is experiencing selling pressure and the degree of selling pressure.
J C Penny
J. C. Penny (JCP) is an example of a stock that experienced distribution for many weeks before the price actually fell. Once the price began to fall, the indicator remained in negative territory for an extended period of time. From March to May, Chaikin Money Flow had been positive (green). On 18-May, the stock gapped up on the open, but the indicator abruptly fell and turned negative (red arrows). The stock advanced intraday on the 18th, but fell by the close to end the day near the lows. Based on the previous close, the stock advanced. However, from the perspective of Chaikin Money Flow, the stock closed near the low for the day on heavy volume, which is regarded as selling pressure.
J C Penny

To prove that this abrupt change was not a fluke, the indicator declined further over the next several weeks and remained negative for almost 3 months, indicating that selling pressure was strong in the stock. Not only did the selling pressure remain for an extended period, but also the degree of selling pressure increased. Chaikin Money Flow reached a low of -.468 (negative 46.8 percent) while the stock was near its highs around 50. The stock began to confirm the selling pressure and worked its way down in June and July.
There were a few weeks in August when the indicator turned positive. This might have been seen as bullish, but it lasted a mere 3 weeks and Chaikin Money Flow only managed to get as high as +.1270. Furthermore, the price action of the stock never confirmed this strength and it is likely that other price and momentum indicators were bearish as well. The positive readings did not last long and by early September, Chaikin Money Flow was trading below -.25 and the stock was trading around 36. This was a solid signal that selling pressure in the stock remained heavy and there would likely be downward pressure on the price before long. The stock subsequently declined below 20 and Chaikin Money Flow has not been positive since late August.
All three indications of selling pressure were prevalent in JCP:
IBM
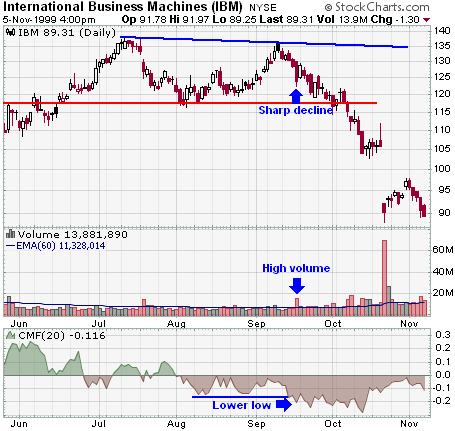
IBM provides an excellent example of a reaction rally that had failure written all over it. When the stock peaked in July, Chaikin Money Flow was already well off of its highs. The indicator was still positive and mildly bullish, but could not surpass +.10 to even partially confirm the high. The indicator formed a double top in July with both peaks well below +.10. After the decline in late July, the stock began to find support and rallied in August, but Chaikin Money Flow would have none of it. The indicator broke below -.10 twice and remained negative for almost the entire month. When the stock reached its September reaction high, Chaikin Money Flow was still negative.
After the September high in the stock, things began to fall apart. On 17-Sept, the stock declined with heavy volume and Chaikin Money Flow recorded a new reaction low. Each of these items is marked with a blue arrow on the chart. By this time, selling pressure had been evident for over a month. Chaikin Money Flow had been negative the whole time and had progressively weakened. The sharp decline in the stock on the heaviest volume in over 4 months indicated something was not right. The final straw came when support at 118.5 was broken and Chaikin Money Flow was trading below -.20.
| Chaikin Money Flow and other Indicators |
It is best to choose indicators that complement each other. In a recent interview with Technical Analysis of Stocks and Commodities magazine, Marc Chaikin advises against using indicators that have common characteristics. It would be redundant to analyze both Momentum and MACD. These are both momentum oscillators that are based on the closing price and reflect the rate of change. Their signals will not be exactly the same, but it would be a waste of valuable time to analyze both. Chaikin singles out the Stochastic Oscillator, CCI and RSI as similar indicators. All three are banded momentum oscillators that are good for detecting overbought and oversold conditions. Buy and sell signals are also generated in much the same fashion. All three are excellent indicators, but it would be a waste of time to follow all three when one will be sufficient.
Chaikin Money Flow can be used to identify the tradable trend. If Chaikin Money Flow has been above zero for most of the past three months, then prudence would dictate that the tradable trend is up. The oscillator is indicating that buying pressure prevails. It would not be sensible to attempt a short sale if the tradable trend is up. By identifying the tradable trend, traders can ignore bearish signals and only pay attention to signals that concur. If Chaikin Money Flow indicates that buying pressure prevails, then positive divergences, bullish moving average crossovers, bullish centerline crossovers and bullish oversold crossovers would be potential buy signals. (A bullish oversold crossover occurs when an indicator advances above the oversold line. This would be a move from below 30 to above 30 for RSI). All bearish signals would be ignored, at least as long as Chaikin Money Flow indicated that buying pressure reigned.
One possible combination of indicators would be the following:
These four indicators have little in common and complement each other very well.