| Average True Range (ATR) |
| Introduction |
Developed by J. Welles Wilder and introduced in his book, New Concepts in Technical Trading Systems (1978), the Average True Range (ATR) indicator measures a security's volatility. As such, the indicator does not provide an indication of price direction or duration, simply the degree of price movement or volatility.
As with most of his indicators, Wilder designed ATR with commodities and daily prices in mind. In 1978, commodities were frequently more volatile than stocks. However, recent Nasdaq price action may belie that notion. In addition, commodities were (and still are) often subject to gaps and limit moves. A limit move occurs when a commodity opens up or down its maximum allowed move and does not trade again until the next session. The resulting bar or candlestick would simply be a small dash. In order to accurately reflect the volatility associated with commodities, Wilder sought to account for gaps, limit moves and small high/low ranges in his calculations. A volatility formula based on only the high/low range would fail to capture the actual volatility created by the gap or limit move.
Wilder started with a concept called True Range (TR) which is defined as the greatest of the following:
If the current high/low range is large, chances are it will be used as the TR. If the current high/low range is small, it is likely that one of the other two methods would be used to calculate the TR. The last two possibilities usually arise when the previous close is greater than the current high (signaling a potential gap down and/or limit move) or the previous close is lower than the current low (signaling a potential gap up and/or limit move). To ensure positive numbers, absolute values were applied to differences.
| Examples |
The example above shows three potential situations when the TR would not be based on the current high/low range. Notice that all three examples have small high/low ranges and two examples show a significant gap.
Typically, the Average True Range (ATR) is based on 14 periods and can be calculated on an intraday, daily, weekly or monthly basis. For this example, the ATR will be based on daily data. Because there must be a beginning, the first TR value in a series is simply the high minus the low and the first 14-day ATR is found by averaging the daily ATR values for the last 14 days. After that, Wilder sought to smooth the data set, by incorporating the previous period's ATR value. The second and subsequent 14-day ATR value would be calculated with the following steps:
In the Excel spread sheet example above, the first TR value (1.9688) equals the high minus the low. The first 14-day ATR value (3.6646) was calculated by finding the average of first 14 TR values. The second ATR value started the smoothing process by using the previous value.
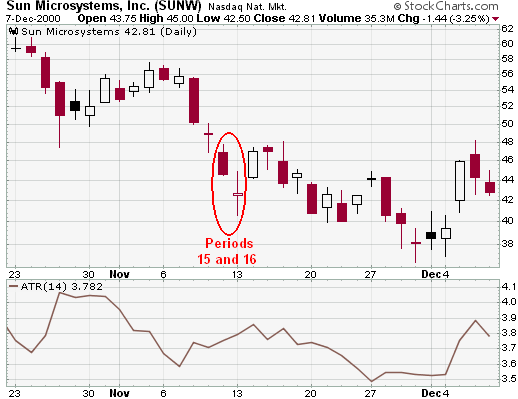
The chart above corresponds with the Excel spreadsheet calculations for Sun Microsystems from 23-Oct 2000 to 7-Dec 2000.
For those trying this at home, here are a few cautionary notes on calculations.
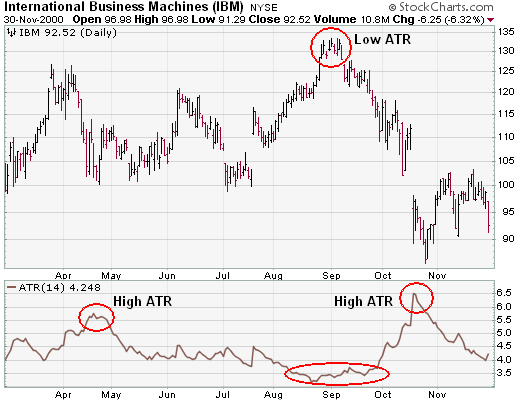
The IBM chart above provides an example of the 14-day ATR in action. Extreme levels (both high and low) can mark turning points or the beginning of a move. As a volatility-based indicator like Bollinger Bands, the ATR cannot predict direction or duration, simply activity levels. Low levels indicate quiet trading (small ranges) and high levels indicate violent trading (large ranges). A prolonged period of low ATR readings might indicate consolidation and the beginning of a continuation move or reversal. High ATR readings usually result from a sharp advance or decline and are unlikely to be sustained for extended periods.