Volume Breakdown (VB)
|
The Formula . . . |
|
Delta = Buy Volume -
Sell Volume
Buy Volume (Ask Volume) = volume that traded at or
above the ask price.
Sell Volume (Bid Volume) = volume that traded at
or below the bid price.
See the Preferences section below
for information on the various results and calculations that are
available from within Volume Breakdown, including accumulation,
statistics, and applying indicators to VB Results.
|
| |
|
The Presentation . . . |
|
|
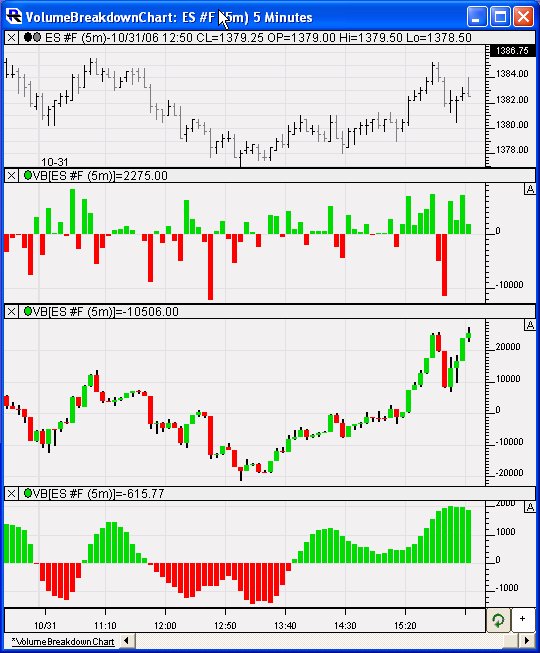
Above is a 5-minute of the
S&P E-mini Futures Contract (ES #F, eSignal). The second pane
shows the per-bar Delta. The third pane shows the accumulated
Delta Bars for the day. The bottom pane shows a 14 period
triangular moving average of the per-bar Delta. |
| |
|
The Preferences . . . |
|
|
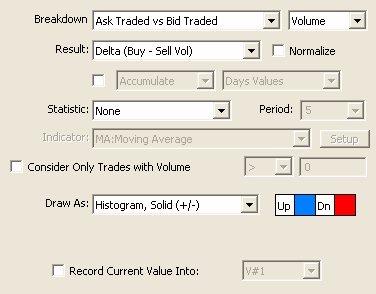 |
-
Breakdown Volume -
Volume can be broken down based on either of two methods:
- Ask Traded vs Bid Trade Volume
- Volume that trades at the ask price is considered buy
volume, while volume that trades at the bid is considered
sell volume
- Up Tick vs Down Tick Volume
- Volume that trades on or subsequent to an up tick is
considered buy volume, while volume that trades at or
subsequent to a down tick is considered sell volume.
-
Result - This list
dictates what the VB indicator will compute (before applying
any accumulation or statistics to it). Result options
include:
- Delta (Buy - Sell Vol)
- difference between the buy volume and the sell volume
- Delta Bars - same
as "Delta", except drawn in a candle bar format, which
displays the opening de
- Buy Volume - Volume
that traded at or above the ask.
- Sell Volume -
Volume that traded at or below the bid.
- Sell Volume (Negative)
- Volume that traded at or below the bid, expressed as a
negative value. This option is there so that Buy Volume and
Sell Volume histograms may be added to the same pane, but
drawn on different sides of the zero line.
- Total Volume -
Total volume traded.
- Total Trades/Ticks
- Total number of trades or ticks.
- Buy Volume % -
Percent of volume within each bar which was classified as
Buy Volume.
- VWAP - Volume
weighted average price of each bar. Each tick is weighted by
it's volume to produce a weighted average price of all ticks
within each bar.
- Big Volume % -
Percent of volume within each bar which was classified as
"Big Volume". "Big Volume" is defined as any trade with a
size greater than a size specified to the right of the
"Consider Only Trades With Volume" checkbox. That Volume Box
will be editable whenever "Big Volume %" or "Big Trade %"
results are selected.
- Big Trade % -
Percent of Trades within each bar which was classified as
"Big Volume". This result simply deals with the number of
trades, as opposed to the size of those trades.
- Average Size -
Average size of the trades which occurred within any given
bar.
- Max Delta - The
maximum delta value achieved within each bar. This is
equivalent to the high seen for each deltabar.
- Min Delta - The
minimum delta value achieved within each bar. This is
equivalent to the low seen for each deltabar.
- Delta Momentum -
Delta Momentum essentially sums up the delta values while
the per bar delta remains on the same side of the zero line.
When delta turns from positive to negative, the result will
reset to that negative values, and the result will continue
to accumulate while the deltas remain negative. When delta
becomes positive, the result will reset back to that
positive value, and accumulate from there while delta
remains positive.
- Delta Mom Count -
Delta Mom Count works in the same way, except it simply
counts how many bars delta has remained positive or negative
consecutively. A value of -5 means we've had 5 consecutive
negative delta bars.
- Matching Volume - High
- Amount of volume that traded on both sides (buy and
sell volume) at the high of the bar. In general, at the
high of the bar, most (if not all) volume will trade at the
ask (buy volume).
- Matching Volume - Low
- Amount of volume that traded on both sides (buy and
sell volume) at the low of the bar. In general, at the low
of the bar, most (if not all) volume will trade at the bid
(sell volume).
- Avg Buy Size -
Average size of all trades that came in on the buy/ask side.
- Avg Sell Size -
Average size of all trades that came in on the sell/bid
side.
- VWAP(Day) - Volume
Weighted Average Price of all tick accumulated throughout
each session.
- VWAP(All) - Volume
Weighted Average Price of all tick accumulated throughout
the entire view period of the chart.
- Delta Finish
- This is the pullback of delta from it's last high or low.
If Delta last bounced off it's high before completing bar,
the finish will be negative (or zero). If Delta last
bounced off it's low before completing bar, the finish will
be positive (or zero).
- Time in Bar (Secs)
- Amount of time, in seconds, spent in each bar.
Especially useful for tick-based periodicities like
tickbars, volume bars, range bars, PNF, Renko, etc.
-
Normalize - An
option was added to the Volume Breakdown indicator to allow
the user to "Normalize" the result. When the "Normalize"
checkbox is checked, the VB Result (such as Delta) is
divided by the volume and then multiplied by 100, to give in
effect a positive or negative percent of total volume. For
instance, a normalized delta of 34 would mean that the delta
was positive, and 34% of the total volume. A result of -100
would mean that all the volume traded in that bar was
sell/bid volume (negative).
-
Accumulate/Avg/Max/Min
- The Accumulate option allows the user to accumulate the
values computed from the Result choice throughout the day
(or throughout the entire chart). If "Days Values" is
chosen, the accumulation will begin fresh each day, and
accumulate throughout the day. If "All Values" is chosen,
the accumulation will start at the begin of the chart and
continue throughout the chart. In addition to "Accumulate",
options are also available to compute the Average, Maximum,
or Minimum value of the day (or entire chart).
-
Statistic - A
Statistic (or indicator) calculation can also be applied to
the Result. Choices include.
- None - No statistic is applied. Just use the
raw Result computed above.
- Average - Average the values using the Period
specified to the right.
- Sum - Sum the values over the period specified to
the right.
- Maximum - Find the Maximum value over last n bars
(n = Period)
- Minimum- Find the Minimum value over last n bars (n
= Period)
- Avg (Least Square) - Performs a least square
average using the Period specified.
- Indicator - When this option is chosen, the user is
then presented with a list of technical indicators from
which to choose (all built-in indicators that I/RT offers).
Select the desired indicator and then click the "Setup"
button just to the right to specify the indicator
preferences. This indicator will be applied to the Result
to compute the final values.
- Speed (Per Second) - divides the "result" by the
number of seconds in the bar.
- Speed (Per Tick) - divides the "result" by the
number of ticks in the bar.
- Speed (Per Unit Volume) - divides the "result" by
the volume of the bar.
- Tick Momentum (T/t) - multiplies the "result" by
the number of ticks in the bar, then divides by the time (in
seconds) of the bar.
- Volume Momentum (V/t) - multiplies the "result"
by the volume of the bar, then divides by the time (in
seconds) of the bar.
-
Consider Only Trades
with Volume (Filter) - This option gives the user the
ability to apply a filter to the trades consider in the
calculation. The user can choose to consider only trades >
than a given size, < than a given size, or = to a given
size.
-
Draw As - Style used to draw the indicator in the
chart.
|
| |
|
The Description . . . |
| The Volume
Breakdown is a powerful and flexible indicator used to gauge
buying and selling pressure, and has attracted quite a bit of
attention in recent months. It looks inside each bar, breaking
down and classifying each tick and then accumulating the
results, and further giving the user a variety of statistical
measures (including all built-in technical indicators) to apply
the these results. The most common use of the VB indicator is to
calculate the delta (difference between the buy (ask-traded) and
sell (bid-traded) volume) of each bar. Positive deltas signify
more buying pressure, while negative deltas signify more selling
pressure. The magnitude of the delta determines the strength of
that pressure. Expect to see positive deltas during uptrends and
negative deltas during downtrends, but look for delta turning
negative at highs, or turning positive at lows...a sign of
possible market turns and good entry/exit points.
With the VB indicator, the Delta can be
computed, accumulated, and run through a variety of
statistical/indicator computations.
The VB indicator is unique in that it
loads tick data (when initially computing) regardless of the
timeframe of the chart, in order to breakdown the volume of each
trade, and calculates on each tick. While it may take a few
moments to initially add VB to a chart, or load a chart which
involves VB, the VB indicator is designed to calculate very
efficiently on a tick-by-tick basis, regardless of the
combination of settings selected. |
|
RTL Token . . .
|
| The RTL Token
for the Volume Breakdown indicator is VB. A common system for
trading the VB might be to look for VB turning positive after 3
negative values:
VB > 0 AND MAX(VB.1, 3) <=
0
|
|
User Strategies . . . |
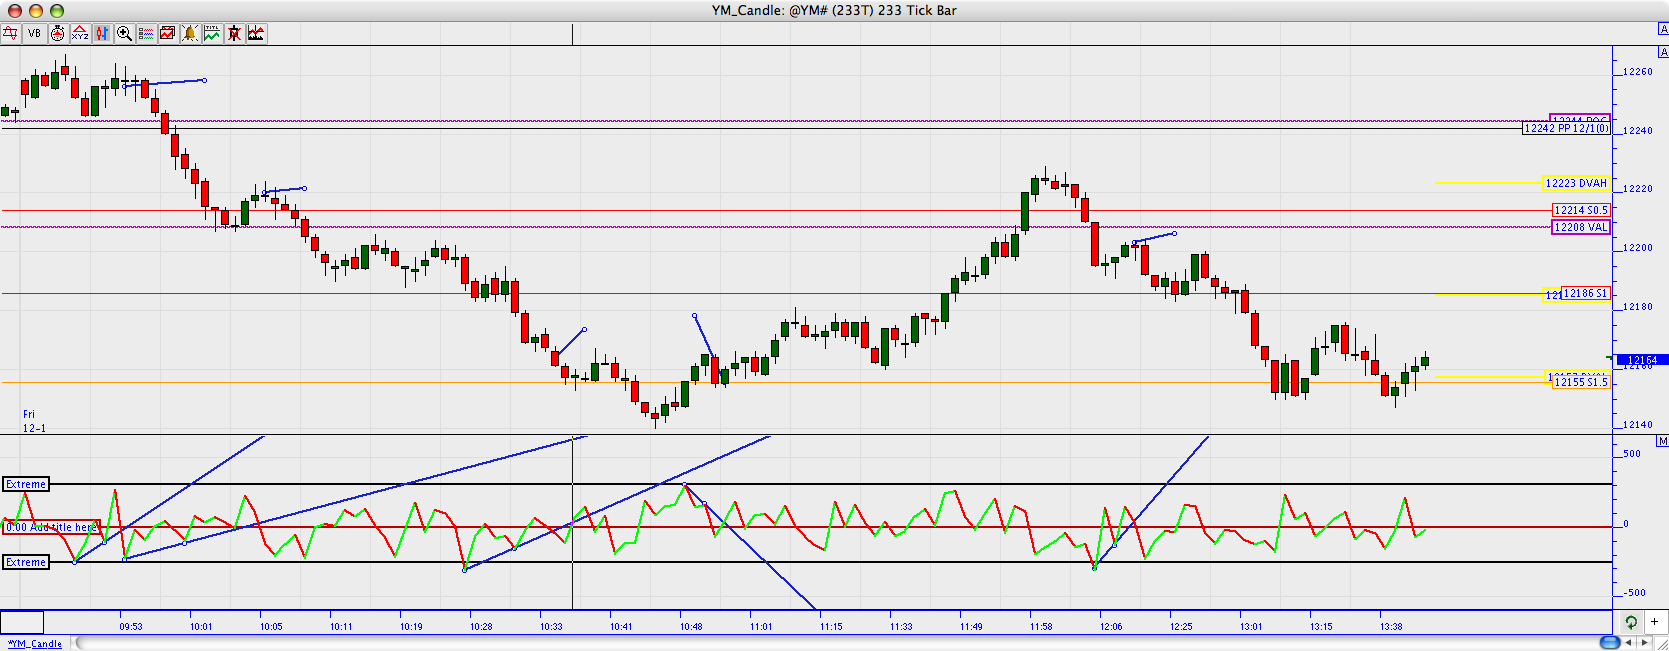
Here's how I use
the VB indicator:
Basically, when we hit that extreme reading, this is where I
start drawing a trendline on my volume breakdown indicator. We
need to have one more high/low from that initial point to
connect 2 points for a line. Once we get a break above or below
that trendline, I put in an order to go with the direction of
the momentum. Here’s some examples with the chart below.
- The first of the day was right after
9:30. I got my short signal at 12256. The pivot below at 242
was completely taken out, and quickly, so my next exit point
is at 12208, VAL. 48 points.
- The second of the day was right back
after a bounce off of VAL. Short was at 12218. There was
continually lower highs until 12165, or right about S1.5. 53
points.
- The third was right after that signal
to get out, and it was long right at S1.5 as it broke 12157.
12208 was the pivot to exit at. 51 points.
- The fourth was on a retracement to
VAL after it broke through it at about 12198. I’d watch for
S1.5 as that has been good support at 12155. 43 points.
So, 4 amazing setups, none were stopped
out and it was good for 198 points. I had about 130 points off
of these similar pivots for yesterday.
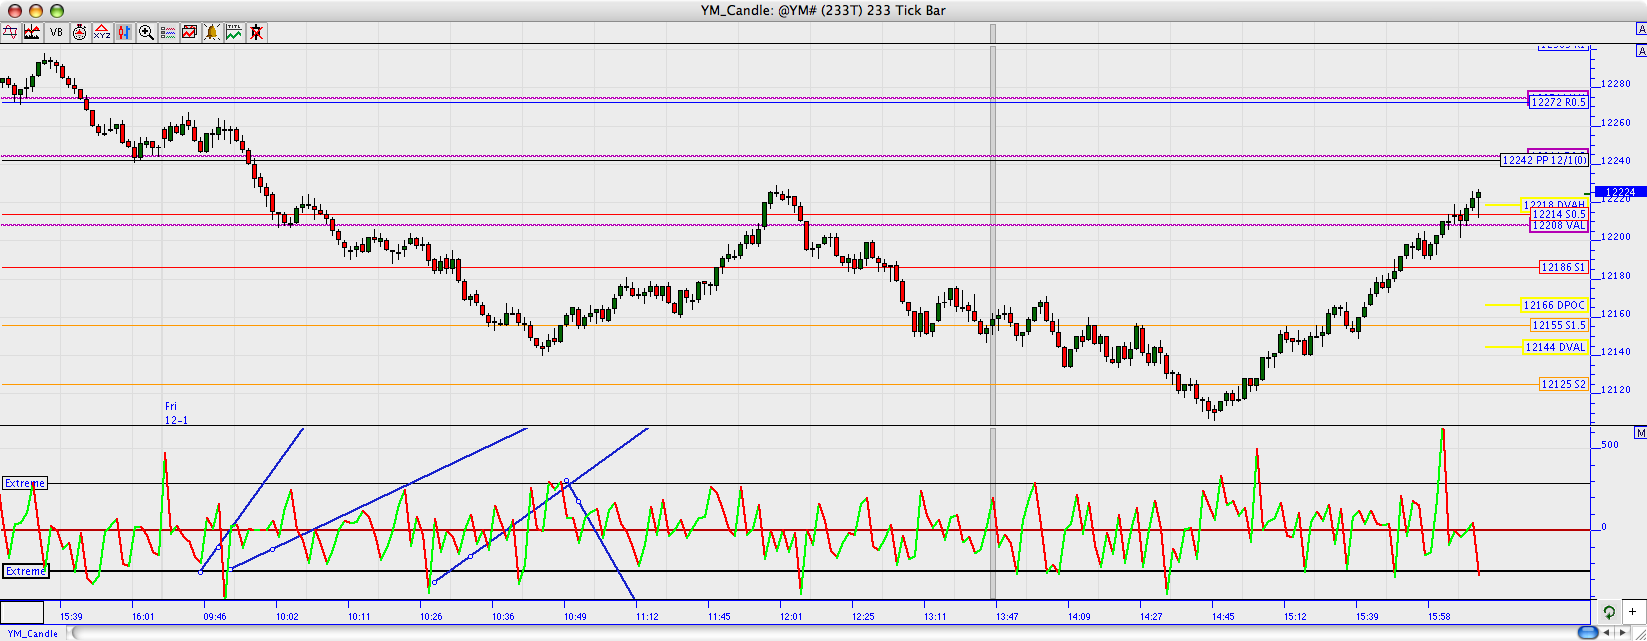
Here's the chart of what I was working
with yesterday:
Also, here at 14:45 you'll notice that the indicator called the
turnaround from just a little above the low of the day, yielding
100 points in 75 minutes.
**************************** |
|