quote:Originally posted by tachyonv Updated
the first post in this thread still more, to try and make the symbol
selection clearer. Been doing this too long, its too easy for me to fail
to explain clearly enough for others. My bad.
Thanks tachyonv.
I
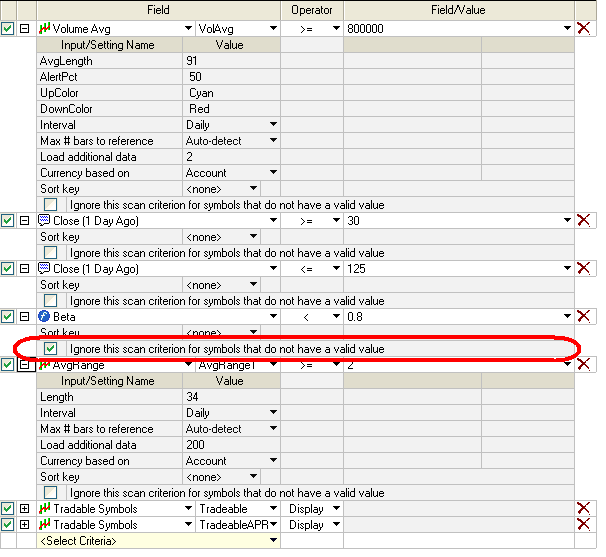
modified Tradeable Symbols to display the info in a TS Scan. It is a
crude RS. I will post the changes if it is alright with tachyonv.
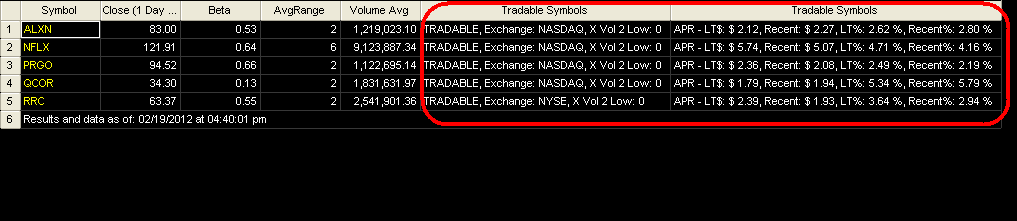
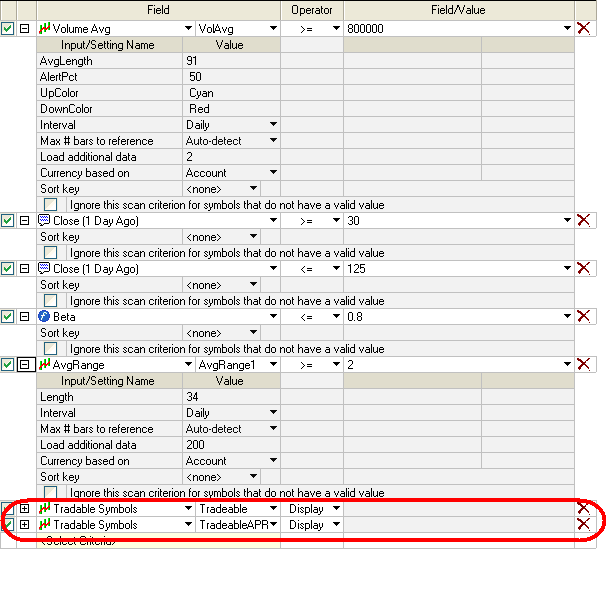
Here is what it looks like and the scan inputs:
The Tradeable Symbol information is broken in to three parts: Tradeable, APR and ATR information. I am showing the Tradeable and APR info in this example:
quote:Originally posted by binthere Hook, here comes a newbie question, how did u make the tradable indy to show in radar?, what did u modify? thx, binthere
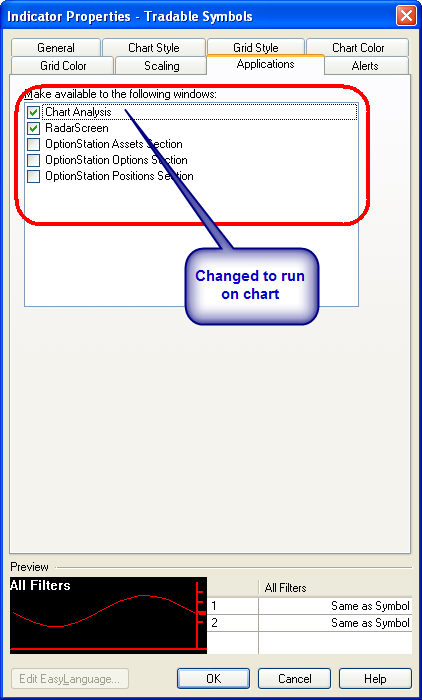
I changed the Tradeable Symbols Indicator so it would work in a Scan. Tach version currently will only run in a RadarScreen.
could you explain what should be changed to make it work in scan so i could learn and not bother in the future? :) when i open a new indicator under development enviroment it doesn't give a option to make indicator available on scan thx, binthere
quote:Originally posted by binthere could you explain what should be changed to make it work in scan so i could learn and not bother in the future? :) when i open a new indicator under development enviroment it doesn't give a option to make indicator available on scan thx, binthere
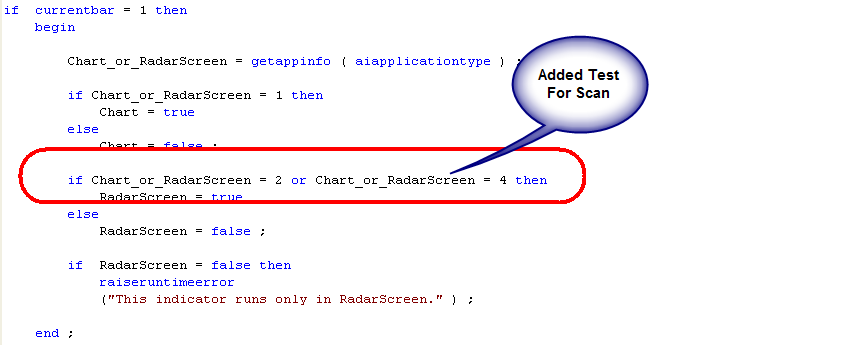
I changed the code:
There are several other code changes I did to build the plot strings which I did later in the code.
Thanks
Hook, I was just looking at that and wondering what if anything to do
since I don't even have radarscreen. Can't the things being done in the
tradable symbols indicator be done with just a regular scan?
Well RS has ways to display plot data that scans do not -- such as identifing info by field name. I built some strings with field titles to give a crude version. Since I don't trade stocks I don't have RS either.
As
your probably the only one here who will have run this scan previously,
would you be willing to share a few Tradable symbols from previous
scan/RS lists from previous runs using these settings as I dont think
this can be done historically ?
I would just like to look back
from the date of the scan and see how often the symbols returned change
and also so I can look back from each run to see how they were trading
prior to the scan
quote:Originally posted by theHook I agree with tachyonv it is easy to get to those numbers or 10 round trips for futures but when you don't use TS as your broker it a bit different.
do the 10 minimum round turns, pays for the $99 platform fee and the $59 RadarScreen fee, $ 160...
Assuming just breakeven trades...
YM is $5/tick. Trade for 1 tick average profit, cover commisions.
Daily RTH range for YM.D is over 80 ticks
5 trades of 2 contracts will do the trick trading small size. Have 20+ trading days with 6 1/2 hours each...
"-
Deviating from the above may result in otherwise easily avoided losses.
Symbol selection is critical and DOES require use of RadarScreen and
the Tradable Symbols indicator. The TS scanner is insufficient. Am
unaware of any scanner on the Internet which can scan as well as
RadarScreen and the Tradable Symbols indicator. Manually look up beta's
on YHOO, does not take very long. TS beta values are on a different
scale than those at YHOO. Including bata in a TS scan will exclude ETFs and ETNs, an undesirable effect."
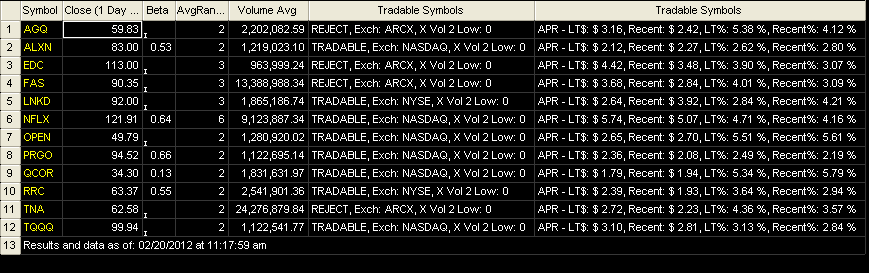
You can improve on your scan a bit to include ETFs and ETNs by doing the following in your scans:
When doing this, you get a different list such as this:
Beware that new issues with no beta and symbols with invalid financial data will appear as well. Example: LNKD
Here's
a slight add-on to Kevin's KJDTimeAvgLow indicator - it now plots the
earliest and the latest low times that occurred during the indicator's
lookback period along with the original avg low time. Here's the code (you may want to rename it to prevent overwriting the original):
tach,
a dumb question. Once you enter a trade at or near to lower keltner
channel, do you every consider the upper keltner channel being
resistance or a barrier for price to continue to rise?
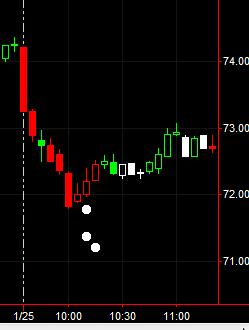
Bought ALXN at Market. Bought
80.53 (10:08) and saw no reason to exit until 81.50 (10:48). Exited
because of the high of 81.55 at 09:40, but looks like could have ridden
higher.
quote:Originally posted by tachyonv Explanation of Beta from SmartMoney:
HOW
MUCH volatility can you expect from a given stock? That's well worth
knowing if you want to avoid being shocked into panic selling after
buying it. Some stocks trend upward with all the consistency of a
firefly. Others are much more steady. Beta is what academics call the
calculation used to quantify that volatility.
The beta figure
compares the stock's volatility to that of the S&P 500 index using
the returns over the past five years. If a stock has a beta of 1, for
instance, it means that over the past 60 months its price has gained 10%
every time the S&P 500 has moved up 10%. It has also declined 10%
on average when the S&P declines the same amount. In other words,
the price tends to move in synch with the S&P, and it is considered a
relatively steady stock.
The more risky a stock is, the more
its beta moves upward. A figure of 2.5 means a gain or loss of 25% every
time the S&P gains or loses just 10%. Likewise, a beta of 0.7 means
the stock moves just 7% when the index moves in either direction. A low-beta stock will protect you in a general downturn, a high Beta means the potential for outsize rewards in an upturn.
That's
how it is supposed to work, anyway. Unfortunately, past behavior offers
no guarantees about the future. If a company's prospects change for
better or worse, then its beta is likely change, too. So use the figure
as a guide to a stock's tendencies, not as a crystal ball.
- - -
Purpose
of filtering with beta in this method is to be able to trade long
relatively safely even on a day when the DOW30 is down 125 points.
It
often confuses people that no standard exists for beta. The issue
traditionally is in regards to the time period of return calculations
and look back time frame. Other issues are if the service is reporting a
adjusted close (dividends) or non adjusted close as this can create a
total return bias. I don't know for sure but I would imagine that these
different services probably report different time frames and thats why
you see different beta numbers. For the purpose of this particular
calculation I would imagine you would want a shorter time frame beta
(less then a year) as you are intraday trading.
I was at a
major bank a few years back which was using the default bloomberg beta #
which at the time was a daily return calculation going 6 months back. A
first year analyst on the equity derivatives desk changed the time
frame by mistake and it took half a day to figure out why mutiple hedges
were way off. Luckily it was a 7 figure and not 8 figure mistake. That
analyst was quickly sent to purgatory, the short term rates/repo desk.
PRGO 10:30 to 10:40 +0.54 PANL 10:35 to 14:15 -0.35 RRC 10:50 to 11:50 -0.55 The
PRGO trade worked great. The PANL trade could have been a few cents
profit but I used a limit order at 13:30 that went unfilled. I should
not have entered RRC. All real trades but small.
All support, education and training services and
materials on the TradeStation Securities Web site are for informational
purposes and to help customers learn more about how to use the power of
TradeStation software and services. No type of trading or investment
advice or strategy is being made, given or in any manner provided by
TradeStation Securities or its affiliates.