If
I use 21 length for the Average Range, RGLD shows up. If I use 34, it
drops off. If I use 27, the midpoint of the range given in the first
post, RGLD does not show up. Only ALXN, EW, NFLX, PRGO and RRC.
Interesting
how we all have slightly differnt lists. My criteria are 3 mo average
volume > 800,000, close between 35 and 125, and beta <= 0.7.
Tachy, thanks for listing your grandfathered symbols as well...
I've
seen a few people mention the good trade in AXLN today, and it does
look like there was a good one around 10:25 ET. But what about entries
at times shown below? What were reasons against entering on close of
bar 1, or bar 2, or bar 3?
My
excuse is I got to busy looking at NFLX. Good thing, lol! Then I got in
at 10:25 but I should have waited so I got out after price recovered
just in time to miss the run up. Made a little however and got lucky to
boot!
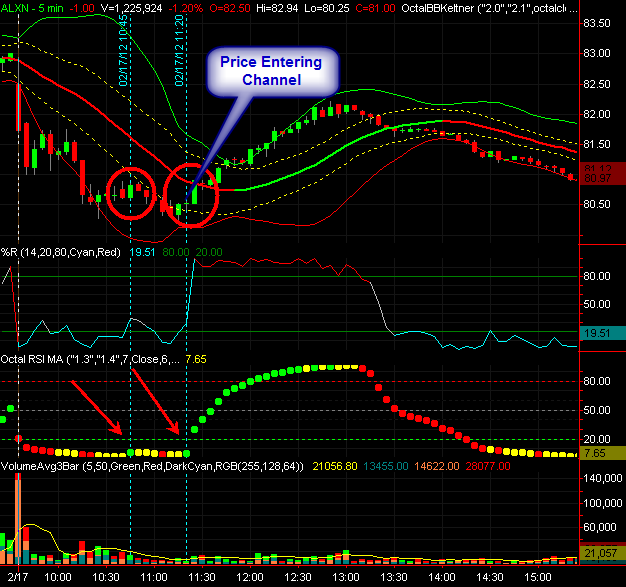
The more I look at this the more I think price may need
to penitrate the Keltner Channell and %R needs to have gone below 20 and
then recovered above for an entry. Still just guessing.
Looking at a porprietary RSI in place of the %R too.
31281 bytes
One of the other suggestion by tach in his first post is:
"-
Often the lowest prices of the morning are between 9:30 AM CDT and
10:30 AM CDT. Study the history of each symbol to see if there is a
recent repeated pattern of such lows. Often the highest price is at
12:35 PM CDT followed by a decline."
So maybe we should not trade before 10:30 AM EDT or ....
I
was using AvgTrueRange instead of AvgRange using a length of 34, so I
fixed that. Now I've only got four symbols: ALXN, NFLX, PRGO, and RRC.
I noticed some of you are using VolAvg(3 Mon) in the scanner, which I
believe is a monthly average, not a daily average, which explains why
the larger number of symbols. Kevin, I entered AXLN at 10:45 when the
%R was turning up, just got lucky.
quote:Originally posted by bwjr I
was using AvgTrueRange instead of AvgRange using a length of 34, so I
fixed that. Now I've only got four symbols: ALXN, NFLX, PRGO, and RRC.
I noticed some of you are using VolAvg(3 Mon) in the scanner, which I
believe is a monthly average, not a daily average, which explains why
the larger number of symbols. Kevin, I entered AXLN at 10:45 when the
%R was turning up, just got lucky.
I think you are right on the VolAvg(3 Mon) based on TS's definition:
"This
is the monthly average of the cumulative trading volume during the last
3 months. It is calculated by dividing the cumulative trading volume of
the last 91 days by 3."
When I use a 91 volume daily average I get the following:
It
also looks like yahoo is returning a different value for Beta than
tradestation's scanner. I haven't found how either one is calculated. I
think tachyonv is using yahoo for his beta value.
Since so far in this thread I have been taking, I thought I'd give a little...
Maybe
it is useful to know the "average" time that the low of the morning
(before 12 PM ET) is made. This little strategy does it. It assumes
Eastern time zone. I used "1" for maximum bars back, so that it picks
up the first day. It assumes 5 minute bars. Here is code, followed by
some results:
I ran this for the last 100 days for the scan stocks, here is the output:
ALXN On average, low occurs at 1022.00 EW On average, low occurs at 1014.00 NFLX On average, low occurs at 1014.00 PRGO On average, low occurs at 1023.00 RRC On average, low occurs at 1031.00
This says, at least for these stocks recently, to look for a low around 10:15 to 10:30 Eastern on average.
"Average"
may not be the best thing to use. Maybe a median time, or most
frequent time, would be better. I'll leave improvements up to each
individual.
Thanks again to tachyonv for starting this thread!
quote:Originally posted by kevinkdog Since so far in this thread I have been taking, I thought I'd give a little...
Maybe
it is useful to know the "average" time that the low of the morning
(before 12 PM ET) is made. This little strategy does it. It assumes
Eastern time zone. I used "1" for maximum bars back, so that it picks
up the first day. It assumes 5 minute bars. Here is code, followed by
some results:
I ran this for the last 100 days for the scan stocks, here is the output:
ALXN On average, low occurs at 1022.00 EW On average, low occurs at 1014.00 NFLX On average, low occurs at 1014.00 PRGO On average, low occurs at 1023.00 RRC On average, low occurs at 1031.00
This says, at least for these stocks recently, to look for a low around 10:15 to 10:30 Eastern on average.
"Average"
may not be the best thing to use. Maybe a median time, or most
frequent time, would be better. I'll leave improvements up to each
individual.
Thanks again to tachyonv for starting this thread!
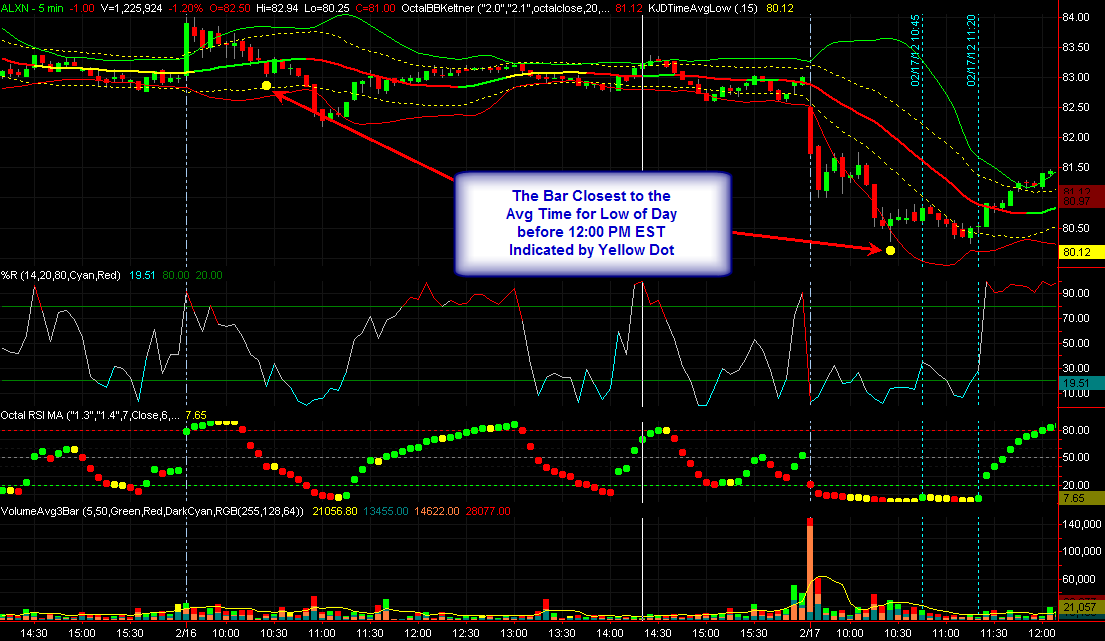
Kevin,
I
took the liberity to change your code to plot a yellow dot on the chart
on the bar closest to the calculated average time to that point created
by your code. Let me know if this is OK -- if not I will remove.
quote:Originally posted by kevinkdog I've
seen a few people mention the good trade in AXLN today, and it does
look like there was a good one around 10:25 ET. But what about entries
at times shown below? What were reasons against entering on close of
bar 1, or bar 2, or bar 3?
Thanks
Hi Kevin:
You're missing tachyonv's ShowMes on your chart (included with "Keltner Channels All") that occur on Keltner crossovers. P.S. Thanks for the code.
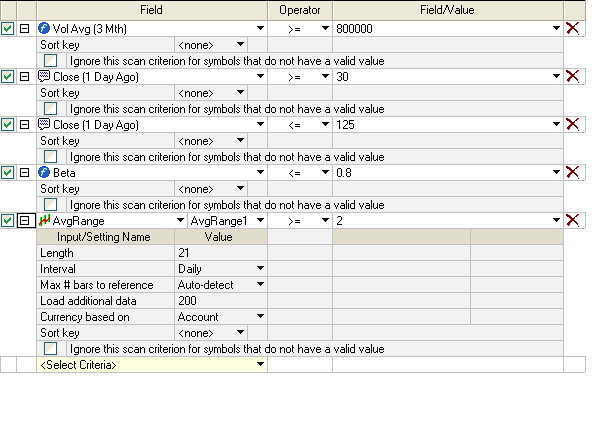
tach, thx for sharing and updating! having trouble with my RadarScreen, would someone share a screenshot of how the RadarScreen looks with the updated conditions? it seems that i'm getting to many symbols, here is mine
quote:Originally posted by binthere tach, thx for sharing and updating! having trouble with my RadarScreen, would someone share a screenshot of how the RadarScreen looks with the updated conditions? it seems that i'm getting to many symbols, here is mine
thx!!, binthere
here is what my scan inputs look like -- at the moment:
All support, education and training services and
materials on the TradeStation Securities Web site are for informational
purposes and to help customers learn more about how to use the power of
TradeStation software and services. No type of trading or investment
advice or strategy is being made, given or in any manner provided by
TradeStation Securities or its affiliates.


 13112 bytes
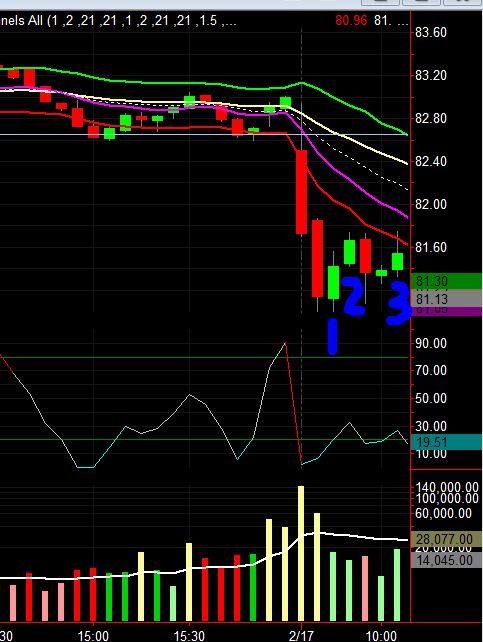
 31281 bytes
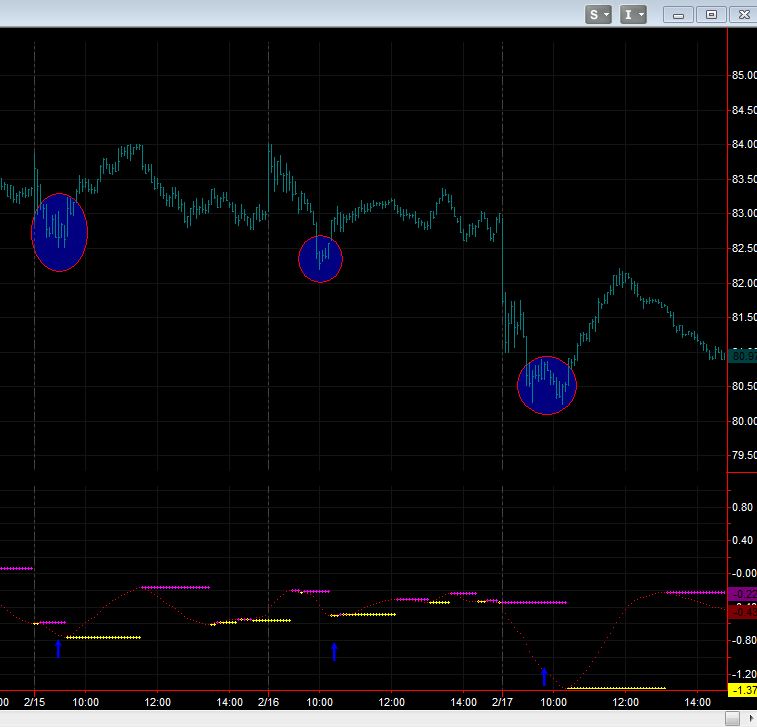
 43282 bytes
 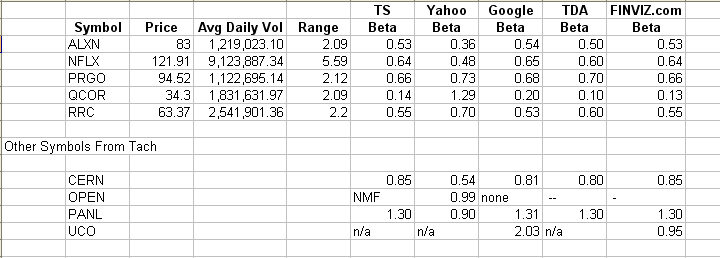 9815 bytes
 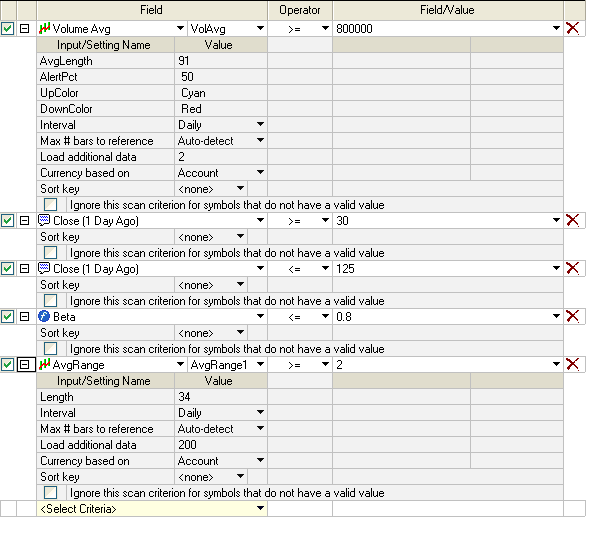 15957 bytes