quote:Originally posted by AdmiralF ALXN
would either have worked or stopped you out depending on when you
entered (before/after 10 CT). QCOR would have stopped out. AF
I
would have entered near the %r crossing the 20 on the way up with price
under keltner. Best guess it would have been around 11:16est at 82.68
(that is what I wrote in my notes).
quote:Originally posted by tachyonv My last screen, as mentioned earlier in this thread, was over 30 days ago, Admiralf.
Does
not have to get to lower KC for entry. I also look at support,
resistance, %R, candlesticks, etc., as explained in a presentation in
Las Vegas at TS Conference in 2004. And at time of day, intraday cycles.
PRGO closed at target profit.
Sounds like my concept of entry is totally wrong --
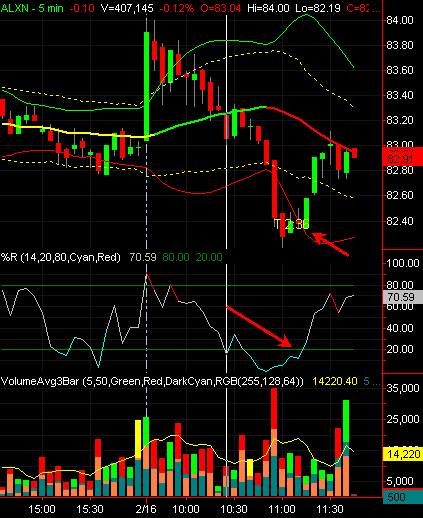
quote:Originally posted by theHook ALXN - looks like it would have worked too (did not trade).
That's an interesting looking volume indicator theHook. If you don't mind me asking, how does it work? Volume of ticks filled at bid vs. ask or in-between?
P.S. Thanks to tachyonv for reminding me of this technique.
No
- lot simpler. It shows the total volume (top of bar) colored like the
bar candle, then the bottom 2 colors are the down and up volume. The
yellow line is average volume. I posted this indicator on the forum
somewhere a while back. I'll see if I can find it.
quote:To
get an idea of .52 target winrate I have written an indicator to plot
the percentage winrate based on being an expert trader buying on the
close of the lowest low 5min bar (If only I knew this beforehand!)
before 10:30(Central) and the highest high since the lowest low bar
being greater than .52. It also assumes the close of the lowest bar is
less than the Open of the day but this can be changed easily to fit your
own entry
quote:Originally posted by split Not
sure if anyone is interested in this indicator but i did find an error
in the way it calculated the days traded so here is an updated version
which also includes inputs so can include closing at endtime.
Made another change to original code to calculate partial profits closing at 1035(Central).
Now Im getting winrates in the 80% area.
Now to find entrys near the lows......
Any help in getting it to work in Radarscreen much appreciated.
Thanks for posting. Additional Performance Stats/metrics can be added.
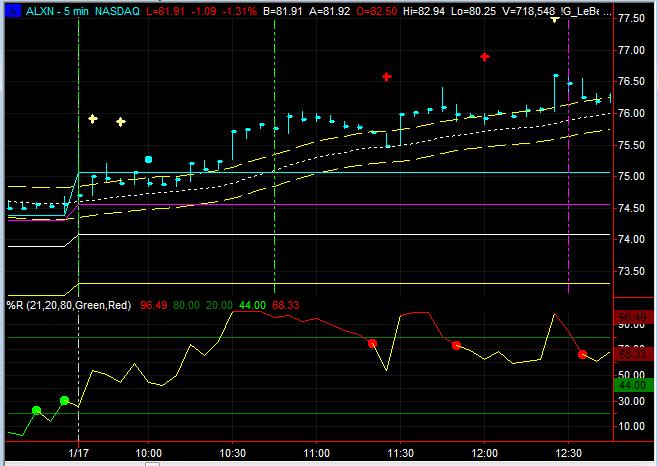
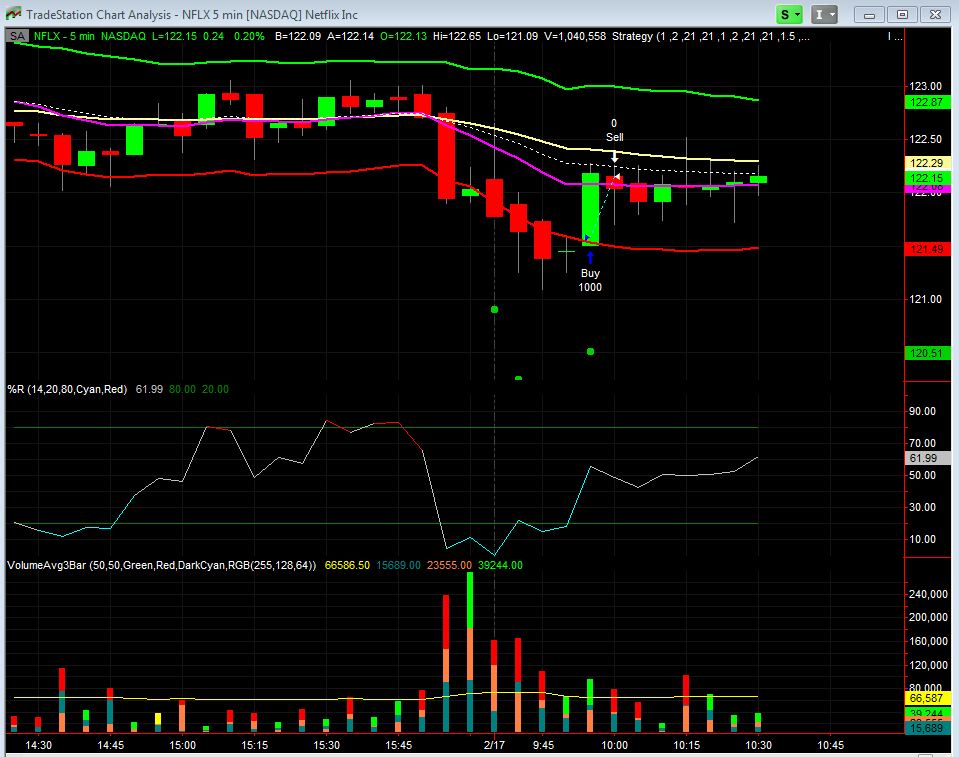
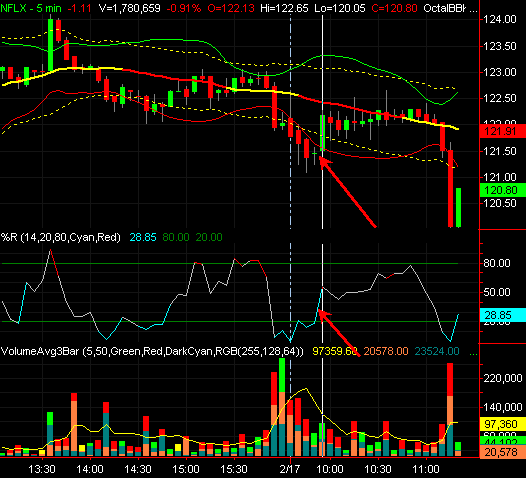
quote:Originally posted by theHook I did NFLX this morning for 200 shares in at 9:55est and out at 10:11est for a +.52.
In ALXN at 10:25est (may regret this one)!
On
the first one, you bought before the RSI closed above 20? That is a
change from how you entering yesterday, right? I guess as tachyonv
says, there is discretion. You picked a sweet entry point! Congrats
Just a couple of questions: - theHook & split: Did either/both of you use support/resistance in your entry considerations? - tachyonv: It's my understanding that entries w/your method should occur after 10:15 and before 10:45, but I see good entries a few bars after open, like theHook's and split's. Is the 10:15/10:45 part of the method flexible?
quote:Originally posted by theHook I did NFLX this morning for 200 shares in at 9:55est and out at 10:11est for a +.52.
In ALXN at 10:25est (may regret this one)!
On
the first one, you bought before the RSI closed above 20? That is a
change from how you entering yesterday, right? I guess as tachyonv
says, there is discretion. You picked a sweet entry point! Congrats
It appeared to be about the same approach on NFLX and it was moving up rapidilly.
I chickened out on the ALXN. In at 10:25est out 11:24est for a +.29.
I
broke my %R rule on this entry. The $Tick had turned green however(
futures trading thing I use ) and price was turning green. A bit later I
wished I had not broke my rule lol. When price recovered, I decided to
exit since my original entry was not within my rules.
In other words - I got lucky!
btw, for my Keltner price, I am using a version of muddbuts close called OctalClose:
quote:Originally posted by ant___ TO: theHook, split and tachyonv,
Thanks for your most recent and helpful posts.
Just a couple of questions: - theHook & split: Did either/both of you use support/resistance in your entry considerations? - tachyonv: It's my understanding that entries w/your method should occur after 10:15 and before 10:45, but I see good entries a few bars after open, like theHook's and split's. Is the 10:15/10:45 part of the method flexible?
Thanks, ant___
No -- not yet -- still working on that idea! Got any?
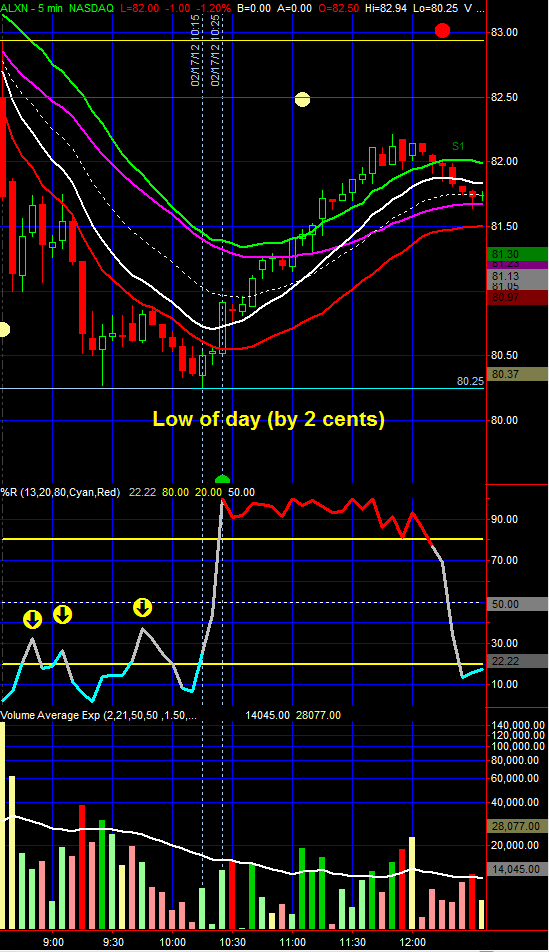
Clearly ALXN would have been a great "Tachy Trade"* today.
I wish I'd taken it. I'm getting warmed up to this method. The past 2
days I made money trading AAPL with a different technique. (It's resting
today.)
Official Tachyonv workspace (as far as I can tell)
except I changed the colors on the fast and slow MAs, since I'm
accustomed to certain colors.
* meant in a good way
A big, big thanks to tachyonv for providing this technique.
quote:Originally posted by ant___ TO: theHook, split and tachyonv,
Thanks for your most recent and helpful posts.
Just a couple of questions: - theHook & split: Did either/both of you use support/resistance in your entry considerations? - tachyonv: It's my understanding that entries w/your method should occur after 10:15 and before 10:45, but I see good entries a few bars after open, like theHook's and split's. Is the 10:15/10:45 part of the method flexible?
Thanks, ant___
No -- not yet -- still working on that idea! Got any?
Yes, lots of ideas...working on them as I watch these stocks.
Question on this Support/Resistance topic: I
suppose I'm simply trying to determine whether the method should
look/work for entries above Yesterday's High. Or, does this stretch the
method beyond reason? Tachyonv, et al, please feel free to comment too.
If
the method is not stretched beyond reason, then when a stock closes
above Yesterday's High, does the fact that it closed above Yesterday's
High add credibility to a Long entry, or not?
Take a look at
ALXN on 1/17/12 from 10:15 - 10:35. The only method criterion that this
doesn't quite meet is "enter at a good price". But I interpreted "enter
at a good price" to mean a low price with respect to the KB. But in
the 1/17/12 case, a good price is not low with respect to KB, it's
relatively high and would have worked nicely prior to 10:45 and even
better before 12:30.
The %R is rising and above the OS line and it's within the times for entry. ant___
Tachyonv,
Thank you for starting this thread and sharing your trading methods. I
made a few trades today based on your ideas. I did well on EW and
ALXN, but lost most of it on RGLD because I let it drop too much. Do
you pay much attention to the %R and KC on the daily chart?
tachy
- using the Tradable Symbols indicator today with default settings
except changing the EMA for APR to 34 (from default 21) gives the
following symbols above 2.0: NFLX (tradable), STRA (rejected), GOLD
(rejected), ALXN (tradable), PRGO (tradable), RGLD (tradable), and RRC
(tradable). Btw, thanks again - had another good NFLX trade today.
All support, education and training services and
materials on the TradeStation Securities Web site are for informational
purposes and to help customers learn more about how to use the power of
TradeStation software and services. No type of trading or investment
advice or strategy is being made, given or in any manner provided by
TradeStation Securities or its affiliates.


 17296 bytes
 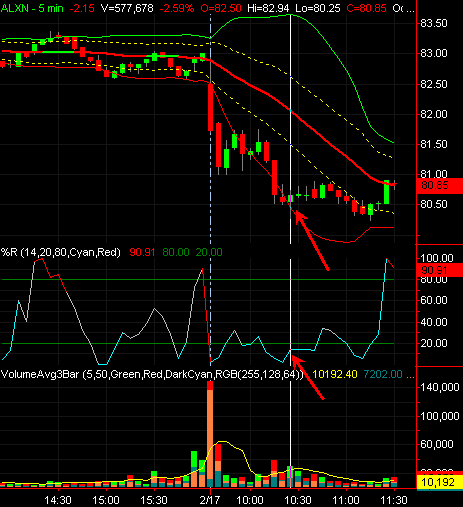 14814 bytes
 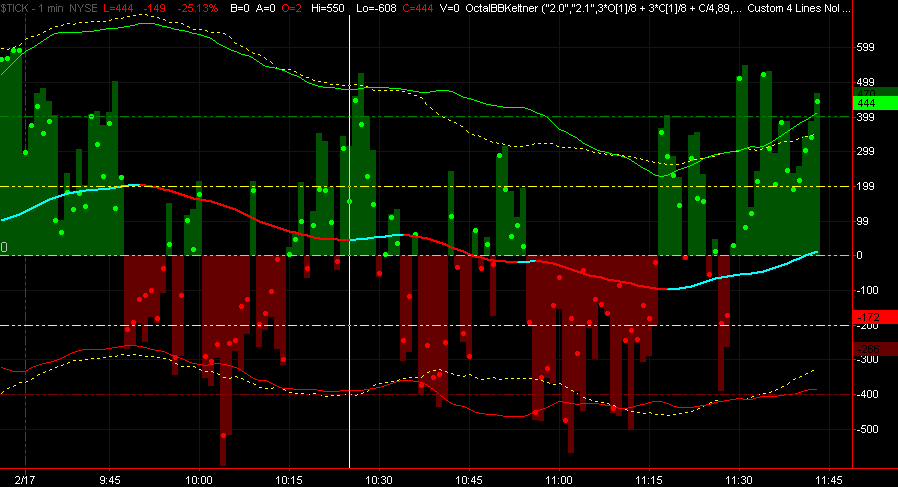 17242 bytes