Place
your cursor over the symbol column, right click, click on "Format All
Symbols." The next window that opens will allow you to set the whole
column to whichever timeframe you chose.
Thank
you TMAN1959. I finally got it to run the way it was intended to do. I
only got 7 stocks that met the criteria. I will have to backtest these
symbols over the weekend. Cheers!
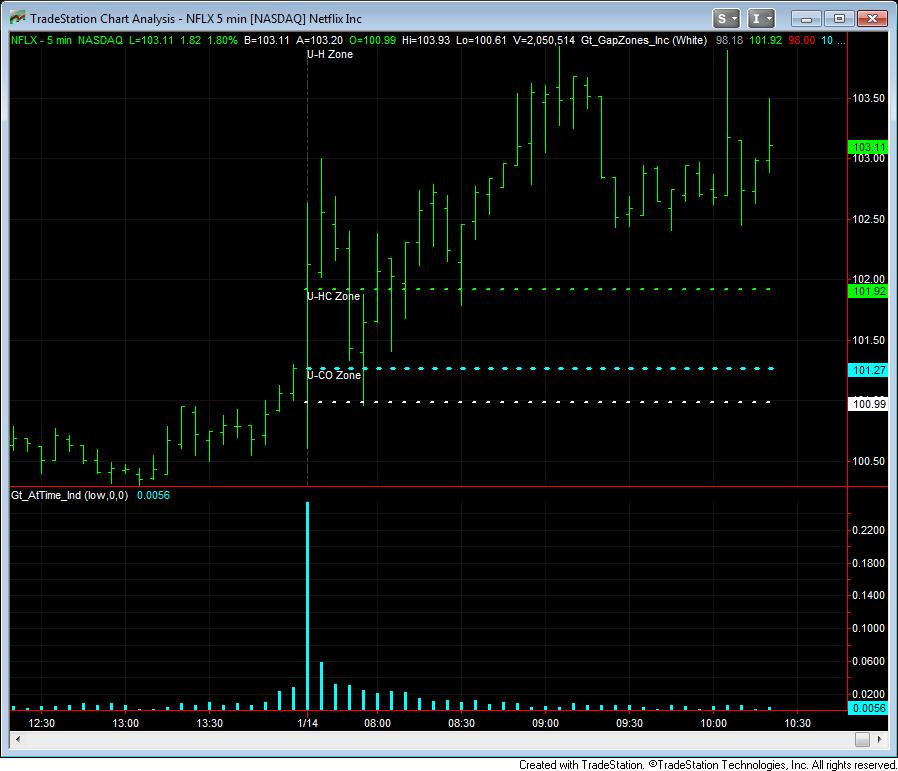
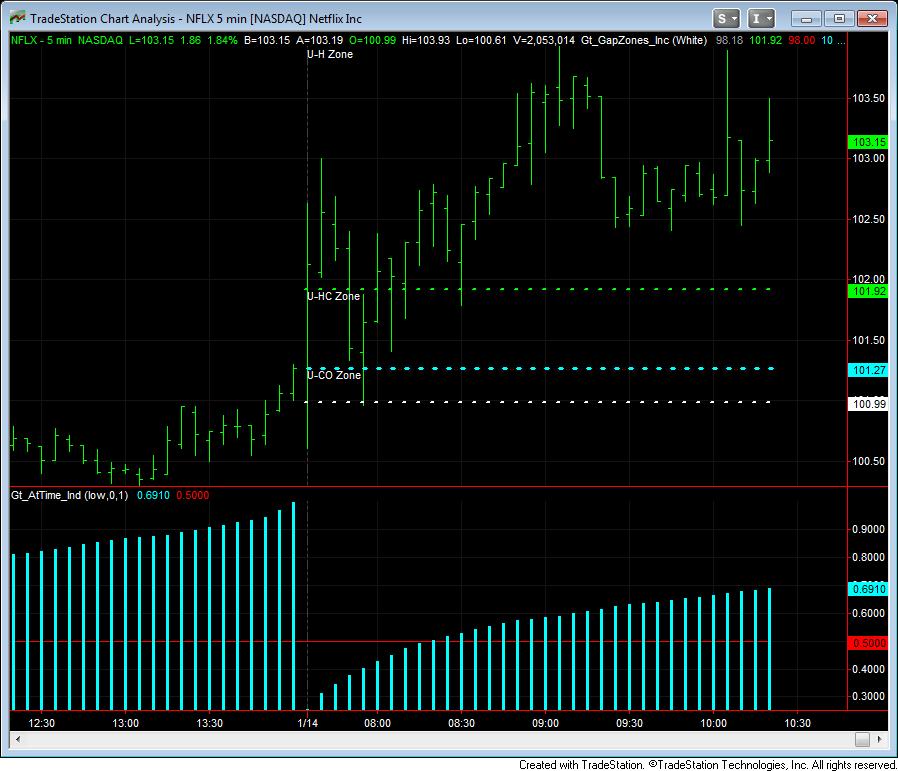
OPEN at 10:00 ET RRC at 10:00 ET ALXN at 10:00 ET (this one would qualify for the 30% that do not achieve the full .52 gain) NFLX from market open until 10:00 ET
All
of these symbols worked using this method today. Haven't checked the
Tradable Symbols filter results lately to see if these symbols are still
valid.
Keep studying this thread (I still do) and remember this from Tachyonv (paraphrased and taken out of context, sorry):
quote:tachyonv:
Does not have to get to lower KC for entry. I also look at support,
resistance, %R, candlesticks, time of day, intraday cycles. Entry time
is flexible. Including pre-market.
quote:Originally posted by nabusafa How is one to know when to exit the trade if price does'nt hit target? This is based on what? Kernel Channels, MA, S/R?
Read first post:
quote:Trade:
-
Buy 1,000 shares at a low price between the open and 10:45 AM Central.
Much of the time, the best prices are between 9:15 AM Central and 10:30
AM Central.
- Sell 1,000 shares after price has risen $0.52/share, the two pennies to cover commissions.
-
Price will not necessarily bounce up that much. Exit regardless by
12:35 PM Central. Exception: on a moderate to strong bullish day, use a
tight trailing stop, or visually monitor to exit, let it run to a larger
profit. Do not let the price gain drop below $.52 on such a day. Once
profitable do not let price drop into a loss.
quote:- Judgment is required for entry and exit, watching the indicators and time
It
is a simple indicator that shows when the distribution of the high /
low of a price series for the day. It either graphs the distribution or
cumulative probability. I did this a while ago after reading some book
that talked about trading the probabilities that a high or low is in
place for the day. The problem with this approach is that you don't
know if it is a high or low that has been put in. It became useful and
tradable for me when I began to filter the proabilities by the days
patterns and seasonality(similar to what tachyonv is referring to).
quote:Originally posted by tachyonv Oops,
changed my miswording above to vertical bands, instead of horizontal.
However, Grumpytrader's indicator is of definite interest and a good
start, if from an oblique side, to the concept of using time as more
important data than price and volume.
Human behavior is driven
by time, to a surprisingly large degree, if one thinks about it. When we
wake, when we eat, when we sleep, when we relax or play. And in many
other ways. Human behavior drives the markets mostly. Time drives human
behavior, including program trading tools used by large institutions.
Therefore,
an entire class of undeveloped tool opportunities awaits - time based
trade analysis, a whole different class of technical analysis. The
intraday cycles spreadsheet is a good starting point towards developing
these tools.
Fantastic Thread.
Cool indicator above...
I've
been studying time a fair bit messing and tried to come up with a way
to figure what bar intervals could trade the current bar. Then... Align
volume to time to see if there was a relationship. The two indicators
below might be helpful, I haven't figured what to make of the outputs
and how to make profitable trade decisions off of them, but they might
make sense to you.
The
blue line is volume standardized over the last 30 minutes, a histogram
of volume below it is present in the screenshot to show how standardized
volume relates to absolute values. I opened up a programming book to
try to figure out a better way to sort values than the way I used in the
second indicator...
I can't say that it has helped me to see
much about time frames and how they relate to price movement, other
than blow my assumptions out of the water that volume enters at
specified times, because of the time scale other traders are using to
study their charts and place their orders.
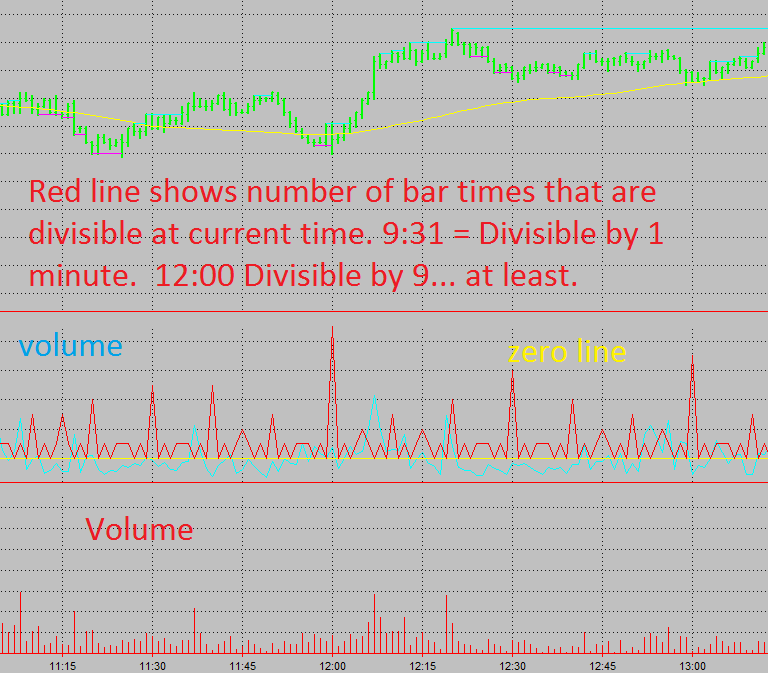
This
is an indicator that does a cumulative minute by minute study of
volume, over the length of your chart. It is a brute force method, and
only generates a printlog on the lastbar of the chart that is comma
separated so you can copy it into excel and manipulate the values. The
list at the bottom that is in green is just so if you want to build
something else, you don't have to do nearly as much typing to get the
ball rolling, Arrays for this purpose were slow as watching grass grow
if you want to go back years. It is set up that 9:31 is minute 1 and
1600 is minute 390... which makes it easier to translate into session
times for other purposes than eastern standard. The output is
Accumulated Volume of that Minute, over the length of the chart Divided
by 1000.
What
pleases me the most is that you are healthy again and back on the
board. We all greatly appreciate your contributions and willingness to
share with others. All the best.
Caveat:
A recent (for me) fly in the ointment is "The Motley Fool". Majority of
its articles are negative. Tends to drive an individual equity symbol
down for one to several days, in recent months. Tends to make its
negative comments self fulfilling prophecies. Good idea to check
premarket on Yahoo! for each symbol, to see if the "Fool" has just
assassinated any symbols you intend to trade - whether with this method
or any other.
... Wish
Tradestation had the ability to bring in news feeds... and use those
assassination attempts as entries if the fundamentals are still strong.
Thank you all for your great input and of course my hats off to Tachyonv for starting this thread.
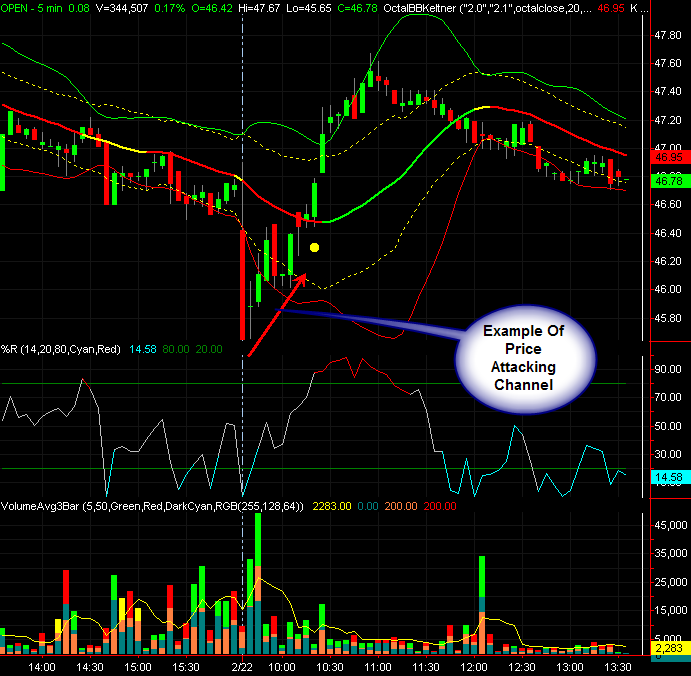
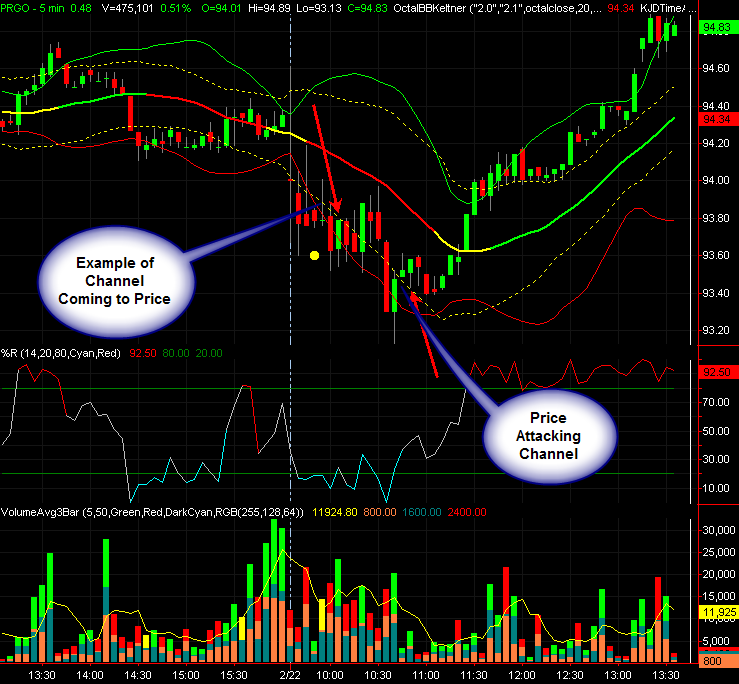
Is there any code to test theHook's "Attacking/Coming to price" methods?
quote:Originally posted by theHook This may be off subject a bit and tach if you wish for me to remove the post just say the word and I will.
When
reveiwing the k channel on several of the stocks indicated by this
method this weekend, I noticed if the price was "attacking" the channel
in a lot of cases this would be a good trade. If the channel came to the
price, then it was better to wait for an enter. We had an example of
each of these, this morning.
Now - disclaimer, listen to tach,
not me. He knows a lot more about this trading method than me. Do your
own analysis. I need to study this more.
Hi traderts123, I
havent see any code for that idea. The lower KC band though will always
move towards falling prices. Though once price bars become bullish they
will per se "attack" the lower band. I think if you have an opening gap
down and a price rally you will see a similar type of movement.
One
of the more trickier aspects of the strategy is discerning which %R
signals will yield a profitable trade. As seen in my own trading and
using theHooks 2nd pic there were 2 %R crosses of the lower 20 boundary
along w/a bullish price candle at the lower KC band that would have been
stopped out assuming you are using the LOD for a stop. Deciding which
of the setups are valid is a key point. R
quote:Originally posted by traderts123 Thank you all for your great input and of course my hats off to Tachyonv for starting this thread.
Is there any code to test theHook's "Attacking/Coming to price" methods?
It
is tachyonv's method. He has posted his Keltner Channels and volume
indicators. There is no "Attacking/Coming to price" indicator, other
than tachyonv's indicators.
That
is correct tachyonv great method is kc and vol indicator. However
precise entry could be enhanced. And even more perhaps a breakout could
be added with code for "attack / coming to price".
quote:Originally posted by traderts123 That
is correct tachyonv great method is kc and vol indicator. However
precise entry could be enhanced. And even more perhaps a breakout could
be added with code for "attack / coming to price".
What do you suggest for precise entry and a breakout?
Your contribution on specific enhancements would be appreciated.
Here
are 2 more trades I made a little while ago in SHW and JOY. Imo, I
think patience in waiting to see some SPY strength is key to a good
entry and helps with the overall success of this strategy. An obstacle I
have run into is getting fixated in trying to obtain a .52 target on
each trade. There are alot of variables working against a fixed target
like the stock's current day volatility (even though it is somewhat
accounted for in the screening process), the spread, prior resistance
levels, continued market strength after entry. Along with the "dont let
a winner turn into a loser", i.e. if you are up .26+ cents and it falls
back to your entry do you exit or ride it out?
Tach as is
mentioned several times in this thread exits prior to a .52 target and
he has posted like 25 different exit strategies. So imo, trying to
consistently make one of them probably will reduce the effectiveness of
the strategy. I would like to hear from other users of the strategy and
any trades you want to share.
Hi
all, new to TS and the forum. Really interested in trying this setup,
but the only range idicator I can find is ATR which I know includes
gaps. Where can a newb find a good avgrange indicator for TS?
All support, education and training services and
materials on the TradeStation Securities Web site are for informational
purposes and to help customers learn more about how to use the power of
TradeStation software and services. No type of trading or investment
advice or strategy is being made, given or in any manner provided by
TradeStation Securities or its affiliates.