|
|
 Posted - 02/14/2012 12:47:56 Posted - 02/14/2012 12:47:56   |
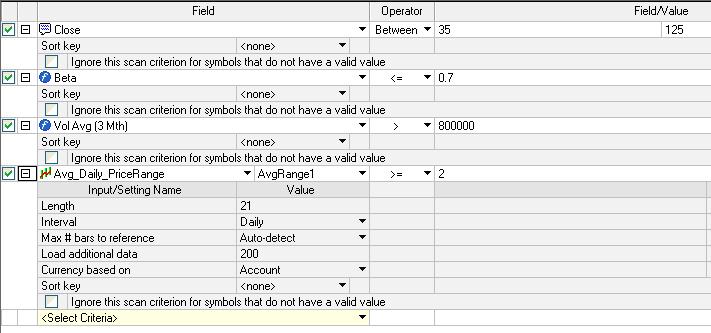
| Having
trouble finding an indicator for the Scanner that will give me >=
2.00 Intraday average price range over last 21 or 34 days. Any
suggestions? |
|
|
|
|
|
|
| Posted - 02/14/2012 13:05:08 |
Thanks tachyonv, I'll do that until I find/write an indicator that will do it for me in the Scanner.
Appreciated.
ant___ |
|
|
|
|
|
|
|
|
|
| Posted - 02/14/2012 15:30:58 |
Thanks Tach for Tradeable Symbols link.
Ive
got the basic scan working and installed the tradeable symbols list
indicator and filtered down to a few handfulls of symbols. I also
backtested a very simple entry and there are certainly some symbols
which are worth further investigation so I can see some $ in the method.
Now the bit I struggle with, buying near lows...... amazed that you (cant) edit CAN see entrys where you can only have a dime DD |
|
|
|
| Posted - 02/14/2012 15:32:11 |
quote:
Originally posted by TradingDude
quote:
Originally posted by kevinkdog
Ok
Thanks, ant! I had beta wrong. And I'm using different volume avg,
and using Daily Range instead of ATR. I get LO and RRC now. I'm
guessing the diff is with ATR.
I appreciate your help!
Scans are not the same
Other difference is Beta >= 0.7(Kevin) versus Beta <= 0.70(_Ant)
AveVol 10 days vs 3 months...etc
TradingDude
Is the Beta calculation in TS the same as the one on yahoo that Tach referred to ? |
|
|
|
| Posted - 02/14/2012 15:44:44 |
quote:
Originally posted by split
Thanks Tach for Tradeable Symbols link.
Ive got the basic scan working and installed the tradeable symbols list indicator... DD
I did a search for "tradeable symbols list indicator" and found only this thread.
What/where is it?
Thanks,
ant___ |
|
|
|
| Posted - 02/14/2012 15:55:13 |
quote:
Originally posted by split
quote:
Originally posted by TradingDude
quote:
Originally posted by kevinkdog
Ok
Thanks, ant! I had beta wrong. And I'm using different volume avg,
and using Daily Range instead of ATR. I get LO and RRC now. I'm
guessing the diff is with ATR.
I appreciate your help!
Scans are not the same
Other difference is Beta >= 0.7(Kevin) versus Beta <= 0.70(_Ant)
AveVol 10 days vs 3 months...etc
TradingDude
Is the Beta calculation in TS the same as the one on yahoo that Tach referred to ?
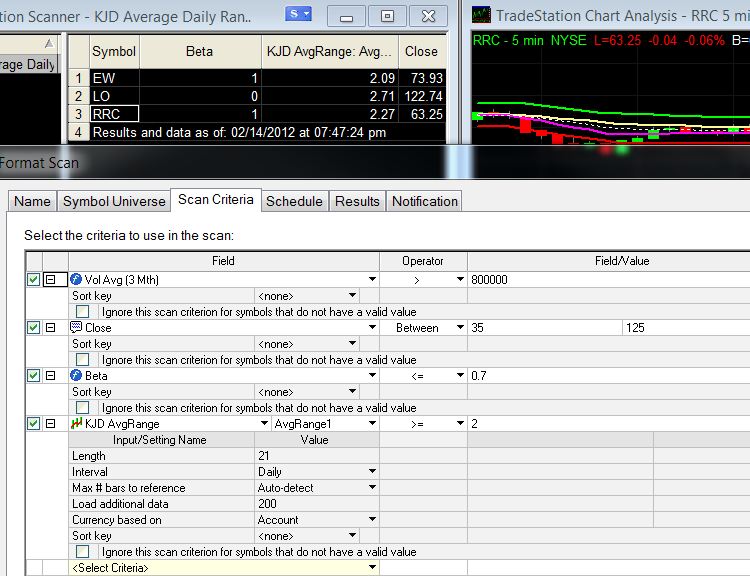
Split,
Don't know anything about the yahoo Beta.
I changed my scan to 3 months Avg Vol and found ALXN, ASEI, EW, GOLD, LO, MNST, NFLX, PRGO, RGLD, & RRC.
Here's the innards:
Attachment:DATA/20120214155419JW Screen 155.jpg 52460 bytes
|
|
|
|
| Posted - 02/14/2012 16:05:38 |
Here is a scan from outside TS using StockFetcher. It returned the following this AM.
Attachment:DATA/20120214155430Scan.JPG 236411 bytes
Tachyonv,
many thanks for your sharing a quality setup, i'm pretty green so this
is a real "gift" from someone with your knowledge and experience. I'll
let you know how i do.
On the health front, wish you all the best. Father's been through similar, just turned 80, going strong! |
|
|
|
|
|
|
| Posted - 02/14/2012 18:44:02 |
quote:
Originally posted by kevinkdog
I just ran it at 4:45 PM ET, and got 3: EW, LO, RRC
Can someone confirm?
Are u talking about a Scanner scan or a RadarScreen Tradeable Symbols run?
ant___ |
|
|
|
| Posted - 02/14/2012 18:51:28 |
Scanner scan. Is that the wrong thing to run? What would the difference be?
Sorry for the ignorance on my part. Believe it or not, in 6 years I've never done either of these things until now! |
|
|
|
| Posted - 02/14/2012 19:03:32 |
quote:
Originally posted by kevinkdog
Scanner scan. Is that the wrong thing to run? What would the difference be?
Sorry for the ignorance on my part. Believe it or not, in 6 years I've never done either of these things until now!
I've run Scanner scans aplenty; but never ran the RadarScreens...am not sure of diff either.
Pleading same ignorance. |
|
|
|
| Posted - 02/14/2012 19:28:13 |
quote:
Originally posted by kevinkdog
I just ran it at 4:45 PM ET, and got 3: EW, LO, RRC
Can someone confirm?
Kevin, my end of day run returned the following: OPEN, NFLX, LNKD, ALXN, RRC, TQQQ, LO & V
Hope that helps.
|
|
|
|
| Posted - 02/14/2012 19:50:25 |
quote:
Originally posted by Tripk
quote:
Originally posted by kevinkdog
I just ran it at 4:45 PM ET, and got 3: EW, LO, RRC
Can someone confirm?
Kevin, my end of day run returned the following: OPEN, NFLX, LNKD, ALXN, RRC, TQQQ, LO & V
Hope that helps.
Thanks
Trip. Maybe a screen shot of how you're getting that will help me.
Here is mine. It runs it on 7937 stocks, and ends up with 3. My
averagerange calc is the 21 day average of the high-low.
|
|
|
|
|
|
|
| Posted - 02/14/2012 22:14:26 |
quote:
Originally posted by kevinkdog
quote:
Originally posted by Tripk
quote:
Originally posted by kevinkdog
I just ran it at 4:45 PM ET, and got 3: EW, LO, RRC
Can someone confirm?
Kevin, my end of day run returned the following: OPEN, NFLX, LNKD, ALXN, RRC, TQQQ, LO & V
Hope that helps.
Thanks
Trip. Maybe a screen shot of how you're getting that will help me.
Here is mine. It runs it on 7937 stocks, and ends up with 3. My
averagerange calc is the 21 day average of the high-low.
Kevin,
i'm not using the TS scanner but my inputs are the same with the
exception of Range, i'm using the 21dayavg + 34dayavg /2, i think that's
the difference. I tried to duplicate your TS settings but not having
the range indicator you use left me with no real range other than ATR.
see attached. I also filter out AMEX for ETF's.
Attachment:DATA/20120214220456Scan.JPG 215828 bytes
|
|
|
|
| Posted - 02/15/2012 07:33:34 |
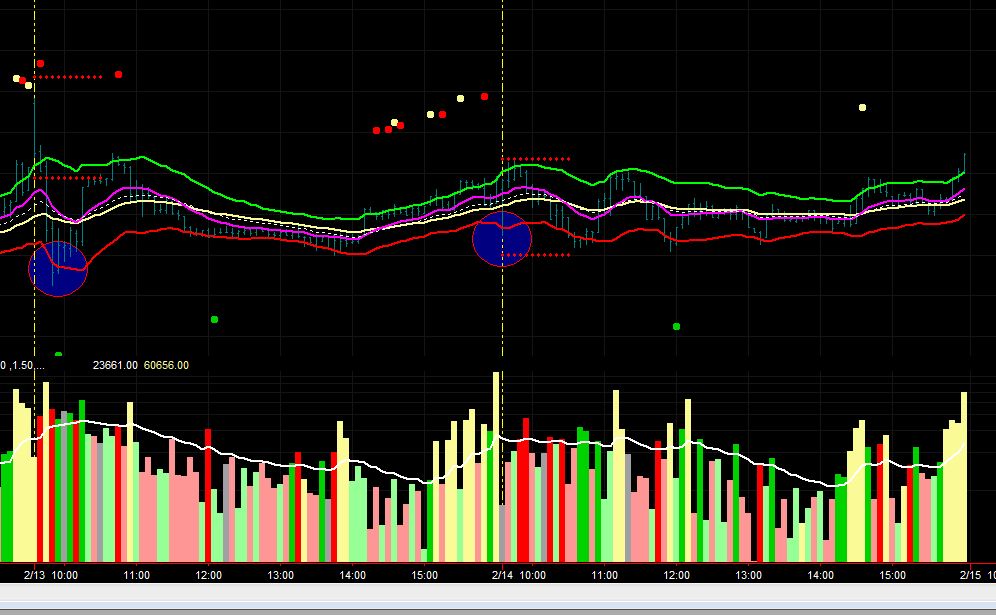
My
scanner produced 8 symbols although I am not able to get the exact
parameters, they would seem to be in the ball park. I have loaded them
all on a five minute chart with the indicators provided. Here is the
chart for LO on which I have circled a couple of low breakouts on the
Keltner channel. I've also added some dots to locate the time window.
Are these the type of entries you're looking for? Do you ever get in on
the opening bar? I was also wondering about putting them in different
desktops as opposed to workspaces. Is that so you can put them on
different monitors?
|
|
|
|
|
|
|
| Posted - 02/15/2012 07:44:06 |
quote:
Originally posted by kevinkdog
Can you show a screenshot how you got 8? I only have 3, so I must be doing something wrong!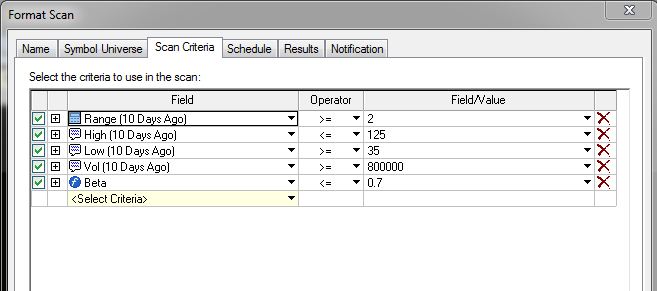
|
|
|
|
| Posted - 02/15/2012 07:49:28 |
Thanks
Tom. I understand now. We have Beta calc the same, all others a
little different. Like "vol" for example. I'm using "vol avg (10 day)"
and you are using "vol (10 days ago)"
It looks like we are doing things the same, just with different criteria. I thought I may just have been doing it all wrong.
I appreciate it! |
|
|
|
| Posted - 02/15/2012 07:58:43 |
quote:
Originally posted by kevinkdog
Thanks
Tom. I understand now. We have Beta calc the same, all others a
little different. Like "vol" for example. I'm using "vol avg (10 day)"
and you are using "vol (10 days ago)"
It looks like we are doing things the same, just with different criteria. I thought I may just have been doing it all wrong.
I appreciate it!
My
lack of familiarity with the scanner caused me to make some incorrect
settings, such as the volume one, but as I said, they are probably in
the ball park. I don't even have the RadarScreen. |
|
|
|
| Posted - 02/15/2012 08:03:33 |
Tom -
It is fun to watch futures guys like me flounder and flop around in the stock world. Now I remember how the newbs feel! |
|
|
|
| Posted - 02/15/2012 10:59:55 |
EDITED:
Before starting this day, I had the wrong idea of the method's normal
trading times and though that an open very shortly after open was
normal; so, do not read the following seriously. See tachyonv's replies
later in thread regarding entry times.
ant___
Trade experience 2/15/12 0930 - 1030.
Had scanned & found ALXN, EW, GOLD, LO, MNST, NFLX, PRGO, RGLD & RRC beforehand.
Typed those into RadarScreen that had tachyonv's Tradeable Symbols indicator running.
RadarScreen quickly showed that GOLD and RGLD were REJECTED; all the rest showed TRADEABLE.
ALXN:
Yesterday in Downtrend (I look at the Keltner Bands for the day and
gauge whether the day was up/down/neutral). Did not see good buying
price till 0955, but since in Downtrend, did not trade. Even at 1042
upmoves seeming sluggish....maybe should have but technicals were not
there.
EW: Yesterday in neutral to Downtrend. Did not see good
buying price till possibly 1010, but I wanted a lower price so did not
trade. After 1010 to 1030 price gradually moved up, but at 1046 am still
glad didn't trade.
LO: Yesterday was in neutral. Open was
strongly up and did not see any price in buying territory. At 1047
price is up well into tachyonv profit range/
MNST: Yesterday
was in neutral to slightly up, especially at Closing. Price today was
not in buying territory until about 1020, but was not low enough for me.
NFLX: Yesterday was up then neutral. Price today quickly rose
too high to enter, then next bar dropped into buying territory. I didn't
trade at that point due to neutral volume and %R was not low enough.
There was a profit to be had here, but technicals didn't support a Long.
PRGO: Yesterday was neutral. Price today quickly rose too high
to enter, then about 1000 dipped into buying range; volume did not
support a Long, and %R was almost low enough.
RRC: Yesterday
was neutral, until closing upward. Today strong up Open and price
didn't reach buying territory till possibly 1025, but that was not low
enough for me.
All in all - a No Trade day for me using tachyonv's very helpful method....not trading is good on days like this.
Edited: Have adjusted my Keltner Bandwidth...should have taken the NFLX trade.
Thanks tachyonv, for the method!
ant___ |
|
|


