if you have a chance it might be helpful to some forum members how you manage a trade if you get in "too early". what
do you do if the trade immediately turns against you....is there a
general rule or is your action dependent upon each individual
symbol/instrument? if you get in too early and get stopped out...do you ever take the trade a second time on the next pivot/signal the same day?
For each symbol, set up one desktop containing Time and Sales window; 5
minute interval chart; daily interval chart; week interval chart; each
with the default number of bars. Format bars to candlesticks. Add
Keltner Channels All indicator to top pane of each chart. %R to middle
pane. Volume Exponential Average indicator to bottom pane.
Study, learn intraday cycles using the Excel spreadsheet at the link
below. This spreadsheet is conceptual, no particular day matches it
exactly and some days match it not at all. Be sure to set the
spreadsheet's adjustment for your desired time zone.
Watch %R, Vol indicator, KC for visual clues, which with practice will become obvious and instinctive.
Price
will not necessarily bounce up that much. Exit regardless by 12:35 PM
Central. Exception: on a moderate to strong bullish day, use a tight
trailing stop, or visually monitor to exit, let it run to a larger
profit. Do not let the price gain drop below $.52 on such a day. Once
profitable do not let price drop into a loss.
Does not matter
much if markets are up, down or flat, providing entry is at a
sufficiently low price. Providing you stick to symbols whose beta is
<= 0.7. Exception: those exceedingly rare days when the markets start
down at the open and continue down through 12:35 PM Central. Take the
loss at 12:35 PM Central or before.
Addendum trade rules:
- One trade per symbol per day. Do NOT exit then get back in. -
OK to scale up entries, but not to more than 1000 shares per symbol. OK
to scale down exits, although most of the time it is best to get out
fast, especially if it is not at least a modestly strong or better
bullish session. - Once exiting has begun, continue until done. Do NOT add to a position once exiting has begun. -
Do NOT carry overnight and especially do NOT carry over a weekend. This
is an intraday trading method, NOT a swing trading method.
can
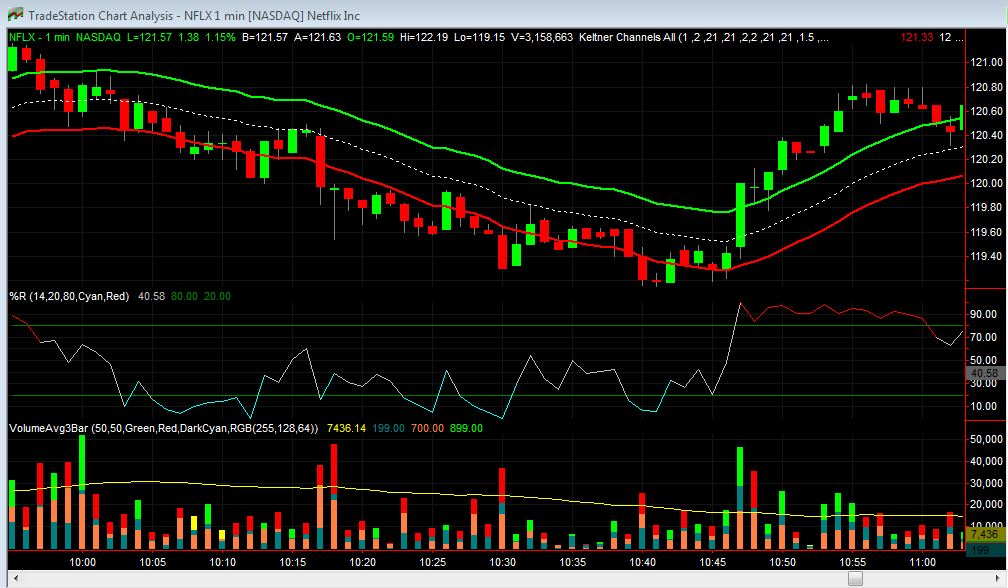
you post your chart from this am NFLX....what do your candlesticks/%R
etc. look like? I would not have entered until between 1045-1050 EDT
(not at 1045 precisely)...based upon candlestick change and %R (I assume
tachyonv uses a value somewhere around length 14, OB 70-80 and OS
20-30.)
I personally do not use tick optimization...I update on every tick.
I
would not have taken the trade at 950 EDT because it was already at
"mid-channel" which is a high risk trade. What this strategy does is
take 25% of range and if you are mid-channel the likelihood of success
of this method diminishes compared to being closer to the bottom of the
channel.
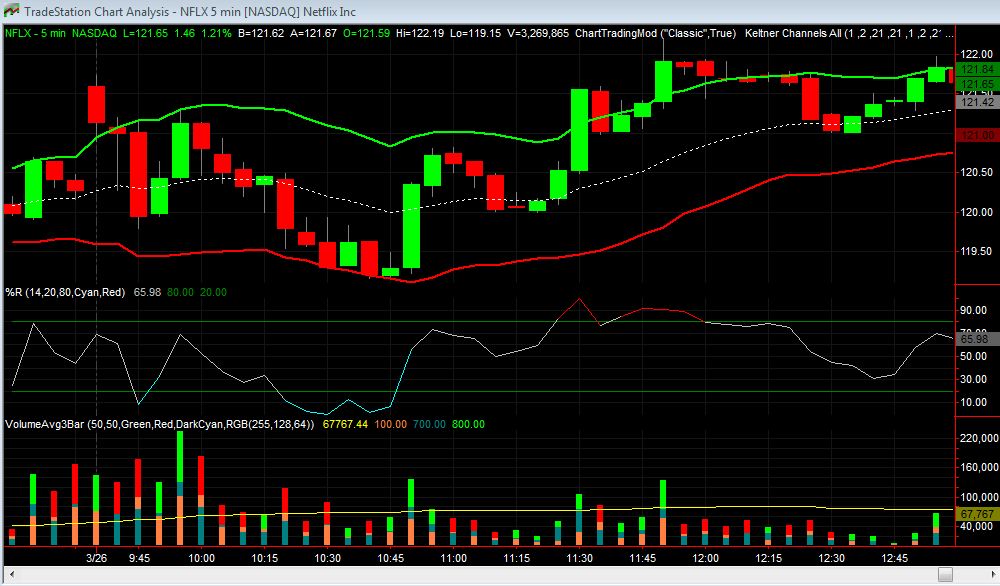
Take
a look at my chart....tachyonv's rules including cycles for this
strategy are based on 5 min. charts...Go back over the last few weeks
and check out 5 min. charts....specifically looking at all of your
entries. The targets/stoplosses are all based on 5 min.
By
shifting to another time frame, many times profits and stoplosses change
in a scalping strategies. You are fortunate that you haven't busted
your account. I just looked at your chart.
Once you go down to
lower time frames < 1-2 minute charts you really have to Know your
indicators, how and why they do what they do. The indicators can be
used but depending upon which indicator you use sometimes have to think
outside the box. I will not get into that here since tachyonv has given
everyone a very nice strategy that simply needs to be mastered and the
discussion should center on that idea.
split I would suggest copying/printing tachyonv's rules and have them in front of you at all times, seriously.
back
to cycles read what I copied from page one of this thread.....when you
get involved with the cycles starting thinking about "why days don't
follow the cycle at all".
quote:This spreadsheet is conceptual, no particular day matches it exactly and some days match it not at all.
I
do not have tachyonv's Keltner indicator so I just threw in the
standard TS with a 2.5, I believe. I don't use keltners/bollinger etc.
because of my trading instrument and time frame...(just like your
keltners on a 1 min. chart) I also don't have tachyonv's volume
indicator, thus it's not on my chart.
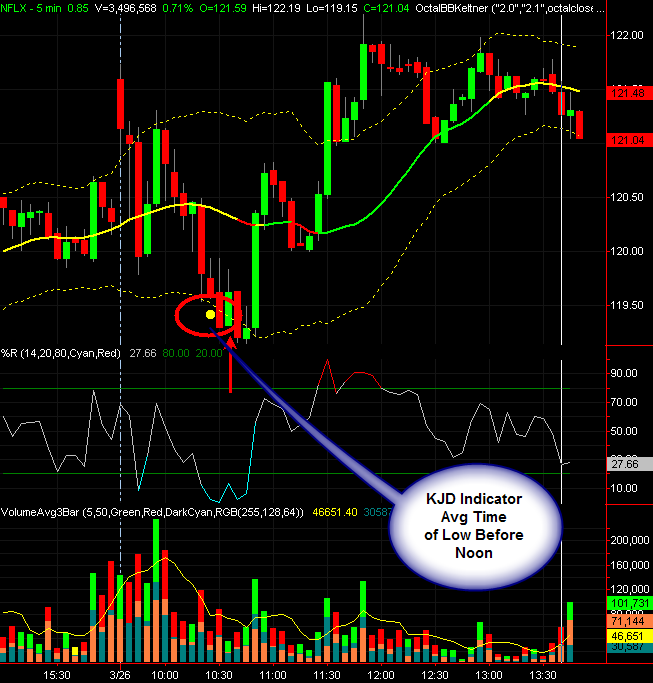
I
have been looking at KJD Avg Time of Day for Low over the last 30 days
and using it as a strating point for my entry. Then if it is either
below the lower keltner or near it, I wil consider an entry on the first
up bar. I have not attempted to fine tune this at the moment.
As
you can see two bars after the yellow dot (KJD avg TOD), was a green
bar breaching the keltner for a good entry. It might be something to
watch for a while and see what you see. The KJD Avg TOD is posted
earlier in this thread.
This is not part of Tach method and if he wishes, I will delete.
just
a suggestion...follow tachyonv's strategy precisely ???using simulator
until you hit 80%....break-even with this strategy is about 70%
including commissions. Sim is NOT the same as real time trading. Once
you are at 80% go real time. You should be able to get 80% very
quickly. Hint: Be careful if you enter significantly above the
mid-channel line, that is why I said I would have entered sometime
between 1045 and 1050. This strategy style works if done properly.
I
would think you would be trading real time this week or next...just
study old charts...run them bar by bar from 8 am - 1130 am on several
symbols. I would begin from the second week in January (avoid the
holiday season...holiday season may trade differently depending upon the
instrument/symbol).
You do know that oscillators function
differently in uptrends than in down trends and differently in sideways
markets...right. I suspect this is why tachyonv won't trade if the
market is down xyz points because the %R signal becomes unreliable used
in a standard fashion for this strategy....know your indicators, know
their limitations, know when they work and more importantly when they
don't work or are down right wrong.
I
just recently came across this post. Many thanks for all your time
tachyonv! There's elements of this scalping methodology I've used for
over a decade. It's tough coming this late to the party/all these
posts.... I'm only a few pages into covering the '19' pages of posts.
Noticed a lot of misunderstanding of tach's rules: beta being checked
for the scan (no!) ATR being used (no! not for intraday trading) I can
possibly add (also a non-automated) TA goodie to pull BOTH the win% and
profit% up I believe, (and will gladly share shortly) but want to ensure
I am UP TO SPEED with the latest SCANNING and then loading into
RadarScreen method with Latest Build version regarding the indicator as
most recently updated and check my correct utilization of this first.
Could you tachyonv or other successful method gurus confirm the following: 1.
Is kevinkdog's indicator correct/best for Intra-day EMA Price (34 or 21
days depending on preference to get adequate symbols) 2. Seems beta
should still NOT be checked/used as part of the TS scan(as many seem to
do!?) just through a manual Yahoo Finance check to help select which
symbols to consider (those with beta<=0.7) 3. Is The RadarScreen
"20060226164100 Tradable Symbols V 5_1 BUILD 26 for TS 8.1" the most
current EasyLanguage Doc File for the radar indicator? Many thanks. A.
Hello, today i've made 3 goods trades. NFLX at 10:32 $119.75 Out 10:49 $120.27 +0.52 REGN at 10:48 $119.38 Out 11:20 $119.89 +0.51 PALN at 11:38 $37.27 Out 11:59 $37:47 +0.20
On
the first NFLX, i was 0.62 cents down in a moment that is more than
what i expected to win. this skirt me, but i got the solution putting
the Target and SL with the OSO and not looking, trusting the price have
more probabilities to return. Of course i put a $1 SL and i ask my self
what would it happened if it goes down, after i would need 2 goods
trades to recover. I'm triying to write my errors that have more to see with my fears than with my eyes. For
example, if i close the target at 0.20 and after i see the 0.52 target
would be easy reached, i write this, to try to gain more confidance, and
can use the Tachy rules as he wrote. Because the bigger fail in my
case is try to cut the trades with an small portion of the target
because my fear of a turnning, and be so confidence on the trade that
don't allow me to state a loss until the loss is more than i was
expecting and can support. Just tell about my trades, because for me
was very usefull first read the rules, but after follow the trades
evrery one of you have posted, going to the chart and studing where are
the entries.
For Quark, yes, i know both: Soraya and Selena, nice latin music. Me, i do it for fun!!!
Make
certain you understand where your orders are held...on your computer,
on tradestation server or on the exchange server. This is important if
you ever have internet connection problems, electricity problems,
telephone problems.
I do not use tradestation as my broker. For scalping trades I use bracket orders (order sends order) and order-cancel-orders.
I
believe tradestation OSO only sends "the closest to the entry point
order to the exchange" ...that means your profit target is sent to the
exchange but the stoploss order in ON YOUR COMPUTER or TS SERVER (please
call them to know where it is located). You need to know what to do
when you internet is not working. Where the other part of the OSO is
held is important.
All OCO (order cancels the other side of your trade) is on your computer if I am not mistaken.
Both
parts of my OSO are held on the exchange servers, so I only need to be
concerned about my OCO, if I have internet problems.
Sometimes
brokers lose connection to the exchange so you need to be concerned
about your stoploss, if you are scalping. This is why it is important
to monitor all of your trades...discretionary or automated.
You are following tachyonv's strategy precisely with 5 minute charts and everything???
Ok gang, finally had the time over the weekend after my initial posts on Page 1 last month to study all 19 pages of this awesome topic that Tachy has so generously shared with us. Again, Tachy, a grateful thank you!
As
I set up the workspaces as specified on Page 1 and again by Quark on
Page 19, there are a few issues that could use some clarification,
please, as my "per spec" Scan Results are way off the mark compared with
most of the current symbols being discussed herein.
1) The per spec Scan based only on Close and Volume snags approx 850-890 symbols. Looks Ok.
2) Price Range: However, when Tachy stated, "Find
equities having >= $2.00 intraday EMA (exponential moving average
price range) over past 21-34 [34=Default] trading days," since there are a few different various POV's on that, what is the exact EMA indicator or code-base
that is being used for this Price Range filter? In using my ATR filter
and trying kevinkdog's code posted 02/14/2012 13:03:50 where XAverage
was employed, most all selected symbols with a daily value >= $2.00
had TS Beta's greater than .8, "riskier" than Tachy suggests, yielding
19 symbols: ALXN, CLF, CLR, DECK, GMCR, JOY, LULU, NBL, NOV, SHLD, SINA,
SM, SOHU, UA, ULTA, WHR, WLT, WPRT, XEC. It also seemed like Hook was
using his own filter as well. Please, what filter (code) should be
employed here?
2) Average Daily Volume:
This seems best filtered by an indicator. Are you all using EMA or SMA
for this? The common length used with various client projects has been
90 bars/days back. Is that what ya'll are using as well?
3) Beta:
Since that seems not to have a "standard" calc, are there any strong
opinions against simplifying things just by using the TS Beta value
instead of looking it up on Yahoo Finance?
While I totally support Tachy's "learn how to fish philosophy,"
I'm still trying to find the correct saw to cut the hole in the blasted
ice in order to drop the bait into the water to catch some of these
$0.52 winners. Fair?
In advance, your helpful replies would be sincerely appreciated. Thanks so much.
I
believe TS beta is on a different scale, and using beta in the scan
eliminates some great ETN and ETF symbols, I'm befuddled why this keeps
getting overlooked. It does take a few minutes to manually check a short
list of symbols, but being old school and having had to do so much more
by hand in the past it isn't so bad. It's always interesting to see
what new comes up though GMCR,NFLX,REGN,ALXN and PRGO are low beta value
symbols... others like DECK show beat as .95(Yahoo) vs. 1.50(TS); CRR
1.09 (Yahoo) vs. .81(TS).
Still hoping for some insight on my
post just above a few seeking clarity on indicators and what refinement
over the 19 pages might be summed up in a Cliff notes form...
I've
used a similar manual detection methodology (And GOSH it is a lot of
work to do it that way! But when you find a candidate it is valuable for
a little while), one difference being plotting Fibonacci retr. on
recent price action based on, and depending upon its current direction I
have found produces some extremely valuable insight regarding levels
that help identify reversal points, and if 'cleared' wonderful signals
confirming higher profit opportunities intra-day.
This was posted by KevinKDog on page 2. It uses a EMA for intraday range for a length of 34 per post 1 on page 1.
AvgRange:
On
Beta, Tach has said use Yahoo. If you use TS Beta, be sure to check the
"Ignore this scan criterion for symbols that do not have a valid value"
such as ETFs.
Thought I had better recap on the method and start from the beginning.
The scan.
With
the settings as described by tachyonv I only get 88 stocks returned
from a symbol list of 7492, but tachyonv states there should be about
950 candidates returned at this stage.
I
set the close to 1day ago because if I use 'close' I only get c.30
stocks returned. This maybe something to do with being in UK and running
the scan while the markets are closed but Im sure for this part
closing price yesterday is good enough.
This is using the
KevinDog price range indicator which uses an EMA 34 calculation. I
wonder what tachyonv used for this part as there doesnt appear to be an
average price range selection available in the standard TS scan. There
is a Price range but only for 1,2... days ago
Thanks hook. Split,
using 800k vol, 34 days, NO BETA YET, etc... SCANNER using 7,941
symbols after apply server filters nets 1006 symbols for me today,
resulting in 53 candidates for transfer to Radar vetting. 31 of these
show as possible to Trade and, Ultimately, Yahoo beta rating reduces
these to: ALXN-b=0.26 PRGO-b=0.32 NFLX-b=0.46 GMCR-b=0.65 REGN-b=0.68 ----------- DECK-b=0.95 OPEN-b=0.97 CRR -b=1.09 NBL -b=1.22 VMW -b=1.26 (just listing beta values over the cutoff as a reference) A.
-
Find equities having >= $2.00 intraday EMA (exponential moving
average price range) over past 34 trading days; last closing price
between about $30 to $125 per share; beta <= 0.7; average daily
volume > 800,000 shares. Put these into a RadarScreen table with
whatever columns of data you wish.
First scan with TS scanner to find up to about 950 candidates with above parameters excluding the beta.
Then
copy and paste those symbols into Tradable Symbols indicator (loaded
into RadarScreen) to further filter those candidate symbols.
So
when tachyonv states "First scan with TS scanner to find up to about
950 candidates with above parameters excluding the beta." does he mean
before the server filter is applied ?
tachyonv did
you have entered NFLX on/after the 1005 bar today (1006 EDT), I would
have ( with a tighter/smaller stoploss)...if I traded equities and this
strategy.
My decision would have been based on candlestick and
how %R functions during an uptrend...channel was obscured/significantly
altered by the large 940 bar.
edit 1040: or would wait to enter on this current pull back. What do you do with such a large 940 EDT bar (2.20)?
Do you bypass this symbol and trade a different symbol, etc.?
If
you didn't enter NFLX on about 1006 EDT....did/would you have entered
on/after either the 1100 bar or 1120 bar (5 minute bar chart)??? The KC
are still "obscured" because of very large 940 EDT bar.
I
personally would have "thrown out"/not utilized the KC because of the
940 bar. How important are the KC in this strategy, how exactly do you
use the channels in the timing of entries? I would use the KC if the
bars are typical in range, but not when an "extreme" bar occurs....is
this completely wrong with your strategy???
Or do you change the configuration (ATR) of the KC to take into account an extreme bar???
It
appears that the resulting symbols that can be traded per Tachyonv
rules, are only a few as they have been mentioned many times here. I
have tried several of them. The key to success was of course the entry
point. I have some losers and winners, still learning.
Please
include your entry and exit times/symbol when you report your trades on
this thread. This is tachyonv's thread and he is hoping people report
their trades so everyone can learn this strategy...and include your time
zone of your charts. I personally don't trade this strategy but have
been following this thread. I scalp on the futures market, using a tape
reading strategy. tachyonv always has a time and sales window open,
which I believe he uses to "fine tune" his entry and exit
techniques...tape reading, to get his % > 93-96%, if I am not
mistaken.
In
my previous posts on this page re: KC I was using the TS KC....I
downloaded your indicator....cool.....significantly much
better...thankyou for sharing.
All support, education and training services and
materials on the TradeStation Securities Web site are for informational
purposes and to help customers learn more about how to use the power of
TradeStation software and services. No type of trading or investment
advice or strategy is being made, given or in any manner provided by
TradeStation Securities or its affiliates.