|
|
 Posted - 08/16/2005 05:59:35 Posted - 08/16/2005 05:59:35   |
| Thanks,
tachyonv, for this great indicator! I´ve incorporated it into my tools
for past few months now and very happy with it. Thanks for the great
contribution for this and other thoughts, ideas, tips, point of views,
among others. |
|
|
|
| Posted - 11/08/2005 11:51:59 |
Thank's Mr tachyonv for your nice work. I like KC very much.
Is it possible (with you parameters) to reset the channel (on ID chart) at the start of each new day ? |
|
|
|
| Posted - 11/23/2005 07:54:39 |
Tachyonv,
Sorry
for the delay of my answer. I were anxious to study all your
documentation before, then make trading for a few day with Keltner
Channel incorporated into my tools. Great indicator ! It is a great
completion at my actual tooling. I use it like if I had worked since
always with it. I make trading through the scalping. With the addition
of the Keltner Channel I have gained much more safety !
Thank
you very much for your documentation on Keltner Channels. I have not
never met before someone that had provided me a documentation so very
educational and unheard of. Thank you very much again, Tachyonv, for
your generous contribution.
var finance |
|
|
|
| Posted - 11/23/2005 11:05:48 |
quote:
Originally posted by tachyonv
Today I updated the KC All indicator to add a fast and a slow moving average.
Now the indicator can (optionally) display either a fast and/or moving average in addition to the Keltner Channels.
This
is an example of how what were once multiple indicators, can be
combined into a single indicator, because of the additional plot
statements provided by TS 8.1.
The primary advantage is to
ensure that these are in synch, for situations where they are combined
for generating signals. I have not combined these in this indicator to
create signals, although I commonly do this in my proprietary
indicators. Of course, you are most welcome to do this if you wish.
A
secondary advantage is that supposedly by having fewer indicators,
there is a performance advantage. I am not so sure about this.
TS
8.1 still does not provide for the means to display (plot and text) in
multiple panes from a single indicator. There is an enhancement request
to provide this capability at https://community.tradestation.com/Discussions/Topic.aspx?Result=1&Topic_ID=36565 . What this would permit doing,
is combining %R and Volume Average Exp and this indicator into a single
indicator for display purposes in three different panes (and with three
different vertical scales).
Currently,
indicators which display on different scales in different panes must
remain separate indicators because of the TS plot and text display
limitations.
This causes redundancy when the multiple
indicators are incorporated into a single indicator for the purpose of
creating signals, but must also be individually duplicated in order to
display in their separate scales and panes.
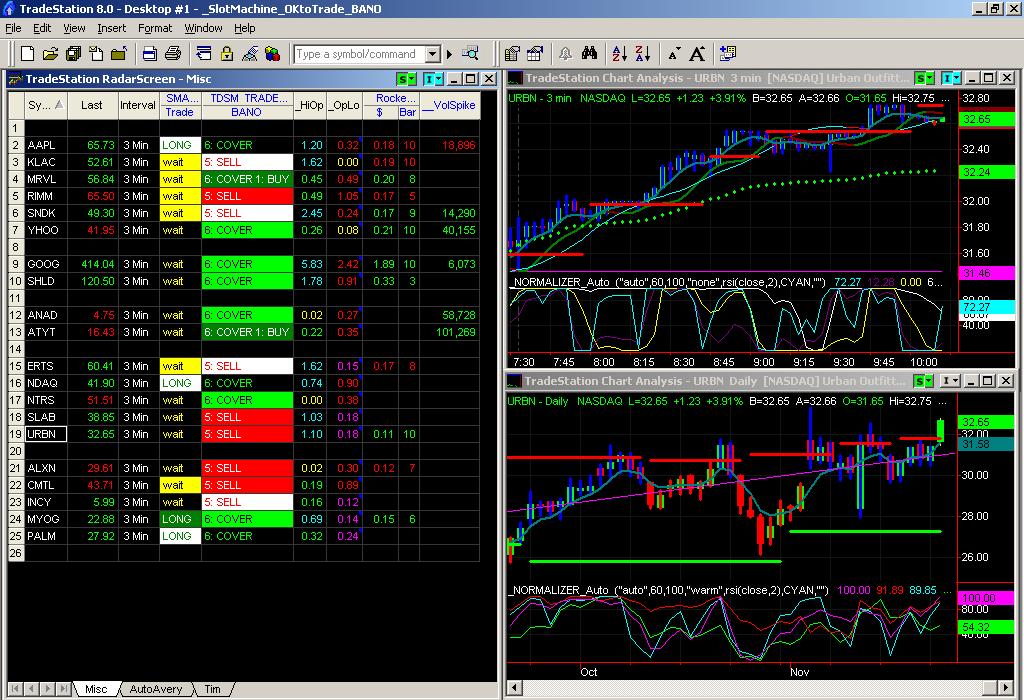
I
wrote THE NORMALIZER.. this allows you to plot indicators indicators
that have different scales in the same window. The 8.1 version allows
up to 8 different indicators. 8.0 version limited to 4 indicators.
Click to enlarge.
In
the top right chart, the yellow line is MACD, the blue line is RSI, the
darkmagenta line is Detrend and the white line is EMA(5). The values
for each indicator are normalized to a scale from 0 - 100 and plotted in
the same window.
In the bottom right chart, the red line is
accumalation/distribution, the blue line is rsi, the magenta line is %r
and the green line is momentum.
The number of periods to normalize over can either be automatically calculated or user specified.
You can find the ELD for THE NORMALIZER here:
Attachment:DATA/20051024203556NORMALIZER.ELD 4350 bytes
MAY ALL YOUR FILLS BE COMPLETE.

Over
and over again, in this newsletter or in any of our products I keep
saying "make your goals smaller", "take one step at a time", "make
$1,000 before you try to make $10,000", "you need to grow a little bit
each day, "you don't have to get it right, you just have to get it
going"... Mike Litman
|
|
|
|
| Posted - 01/06/2006 23:30:25 |
Tach,
Thank
you very much for your generosity in making this indicator freely
available and including such thorough documentation. Your insights on KC
have really opened my eyes on possible ways to use them. It is rare
that somebody is so willing to help others find their way. Thanks! |
|
|
|
| Posted - 02/02/2006 21:45:49 |
Nice work on the indicator, Tachyonv!!
I especially like the commentary box.
Looks like I'll be studying your code for tricks.
Thanks for sharing.
I appreciate your efforts.
MAY ALL YOUR FILLS BE COMPLETE.
|
|
|
|
| Posted - 02/06/2006 00:41:44 |
"The
plot code changes introduced to this indicator an undesirable display
of extra columns in RadarScreen, because TS has still not provided the
EasyLanguage capability to control suppressing unneeded chart plots in
RS tables. I'll fix this when TS fixes EL to provide this needed
capability."
In my code (still 8.0), I have been using an input iPlotType, where "C" for charts and "R" for radar.
This allows me, the programmer, to control what is displayed and when it is displayed.
So with your indicator, I would bracket the unwanted radar plots with
If iPlotType = "C"
then begin
Plot... ; // plot on chart only
Plot... ; // plot on chart only
end;
Of course, in 8.1 you can detect if the indicator is being called from chart or radar.
HTH. |
|
|
|
| Posted - 02/06/2006 11:48:41 |
quote:
Originally posted by tachyonv
For
those herein who wish to be sent a copy of my "Trading with Keltner
Channels" presentation from the October 2004 TradeStation World
Conference, please private message me with your email address, real
name, city and state (or city and country if not USA). Latter info is
so that I can track to whom I've given the copy righted presentation.
The
file size as a transmitted attachment is about 6 mb, which most of the
free email services will not accept, therefore please be sure that your
email provider will accept an attachment of this size.
That size also makes it too large to post here.
Like
all presentations, the greater value is in the verbal portion. If I
happen to present this in your city someday, it may be helpful to hear
that portion.
|
|
|
|
|
|
|
| Posted - 02/06/2006 23:29:10 |
KC_All Ver.4.3 Build 23 02/05/2006 has raised questions in RS.
MY Current Settings:
Daily Interval is used.
KC_Alert is True.
UpDate IntraBar is ON.
Problems Encountered:
Unable to Disable the Commentary.
During the Trading Day the $Predict Column only indicates the"Caution" condition.
The "Bullish" and "Bearish" conditions are not indicated until immediately after the close.
The VolPred Value of the Volume Average Exp Indicator updates correctly during the trading day.
Do You have a workaround for these conditions?
Thank You,
Radar |
|
|
|
|
|
|
| Posted - 02/07/2006 13:29:53 |
Many
many thanks to Tachynov for sharing your Keltner Channels presentation
at the 2004 TradeStation Conference. The indicators, stategy and
explanations are excellent.
I have been trading for 5 years and
have been stuck to the old style of MACD and Stochastic. I am very
grateful to be able to learn a new trading system. I have searched and
read all your postings with great joy. Again, thank you so much for
sharing and your willingness to go an extra step to help. |
|
|
|
|
|
|
| Posted - 05/06/2006 14:52:06 |
THANK YOU TACHYONV!
Started
using the Keltner Channel All Indicator, Williams %R and the Volume
Average Exponential Indicator....setting up the work space as you
suggested. I would like to say that I have been getting great results in
the short time I have been using these indicators. Combined with a few
other things, my trade profitability has increased to 75% which is
amazing. Entries are great, all I need to do now is improve my exit
strategies as I have been taking profits too early. My sincere
appreciation for your generosity and willingness to share and teach
those of us who are less experienced and less knowledgeable. |
|
|
|
| Posted - 06/02/2006 14:15:29 |
Greetings Tachyonv or other helpful coders,
Can
someone help me as I'm new to TS and EL so I'm sorry for my lack of
coding skills. This request may be of help to others as well. I use
the KC range (diff between UKC and LKC) as a profit target and stop loss
indicator and would like to display this value on my charts. Would it
be too much to ask if an input (true/false) could be added that would
place the UKC/LKC delta text in the space to the right near the
top/bottom (inputs ?) of the current bar KC? Or anywhere that is easy
to view the range of the KC's. I know this will help me and I hope it
will help others as well.
Thanks for all the help and best regards,
Sky |
|
|
|
| Posted - 06/30/2006 13:42:16 |
quote:
BTW, TradeStation EL classes are great. (Now if TS would only provide the advanced class here in Dallas area .)
TradeStation
Education should be able to provide all these courses on-line,over
weekends or over periods of evenings and weekends as to not miss out on
trading. Many organizations do.
Cost to participants should be a lot less.
TradingDude
|
|
|
|
| Posted - 07/02/2006 01:26:44 |
| ...roger
that...BTW, what every happened to eKam....and the "where is eKam?"
post....did it get whacked?....never did find out what happened to ekam,
:0{ ... I hope all is well. Later...Sky |
|
|
|
| Posted - 12/16/2006 12:14:57 |
Good Morning jdk !
I
am reading and studying your scalping strategy posted from you the
04/23/2005-18:15:47. I already downloaded your indicators posted into
ELD files. I work on the e-mini ES.D with Tick charts. Now I am
preparing the charts with the same time frames that you utilize.
Unfortunately my experience with TS is still young and I never utilized
before a chart of 30 minutes, so it, on the "time axis labels", don't
appear subdivided like your chart of 30Min.
I send you per attachment my 30M. ES.D chart and like that you will be able to understand what's my problem. Attachment:DATA/20061216115933ES.D - 30 Min.jpg 135681 bytes
Please
jdk, can you suggest me what I have to do so that I can get a chart of
30M. with the same time axis labels like yours. Thanks in advance,
steel |
|
|
|
| Posted - 12/16/2006 12:30:33 |
steel,
that 30 minute chart is on the ER2 (mini Russell). The time axis will
be different from the ES. Perhaps I don't understand your question. If
you can clarify, maybe I can help.
jdk |
|
|
|
| Posted - 12/17/2006 08:07:46 |
quote:
Originally posted by jdk
steel,
that 30 minute chart is on the ER2 (mini Russell). The time axis will
be different from the ES. Perhaps I don't understand your question. If
you can clarify, maybe I can help.
jdk
Hi jdk,
thank you very much for your prompt kind reply.
Yes, I seen that your 30 minute chart was on the ER2. What I mean is the following :
the
behaviour of indicators (MACD-CCIsmoothed-KeltnerSqueeze) on your 30
minute chart, is visible with a interval, on the time axis, of h.1.30 :
at the h.2 - 3.30 - 5 - 6.30...an so on, in a daily trading. My chart,
as you can see, shows, for a daily trading, only two intervals : at h.12
and h14(2pm). Why ?
On the other hand, also with a chart of 30
minute di ER2.D (look per attachment) I have only two intervals, the
same like ES.D. Why ?
Practically, my chart of 30 minute with ES.D or ER2.D
shows a space on the time axis for a daily trading much more restricted
than your chart. Consequently also the trend of the price and
indicators are seen in a much more restricted area. Attachment:DATA/20061217080011ER2.D and ES.D 30 Minute charts.jpg 149487 bytes
It's possible to get a 30 minute chart with time's interval on the time axis equal to your chart ?
Thanks for all the help and Best Regards,
steel
|
|
|
|
| Posted - 12/17/2006 09:26:53 |
jdk,
sorry
but I have still a question : I can't find the indicator "Classic
Stochastic". In my TS8.1 build 3258, I have StochFast, StochSlow, Stoch
Coloured and StochRSI. Where can I find the Classic Stochastic ?
In
your 3minute chart, the Momentum indicator is applied like histogram ?
Sorry jdk if I am taking up to much your time, I thank you for your
patience and the help that you will give me.
Best regards,
steel |
|
|
|
| Posted - 12/17/2006 10:36:28 |
steel,
the only thing I can think of is that you have the chart compressed.
Go to the top of the toolbar on the right, there are two icons with
arrows pointing in and out - you can increase or decrease bar spacing
with them. Try increasing the bars - this will expand the x axis.
Attached is the classic stochastic ELD. Attachment:DATA/20061217103621CLASSICSTOCH.ELD 17695 bytes
|
|
|
|
|
|
|
| Posted - 07/15/2007 13:21:04 |
| Tachynov..would
like to pm you for a copy of your presentation on Keltner. HOw do I do
that? Or please send a copy.to me Thanks |
|
|
|
|