|
Relative Strength At Reversal Time
|
Relative strength is not referred to as the
indicator known as RSI, but as a stock's
strength or weakness at the moment when compared
to the market as a whole, or the particular
sector to which the stock belongs. The concept
of relative strength can be used on any time
frame, and is only valid in that time frame. For
example, a NASDAQ stock showing great relative
strength on a 5-minute chart is a stock which
has a 5-minute chart that appears stronger than
the NASDAQ 5-minute chart. It would be valid to
look at this for a scalp or possibly to enter a
day trade, but if it does not show any relative
strength on the daily chart it would not be
favored for a swing trade.
"5-minute chart is stronger",
means specifically that the bars making up the
chart show greater strength for long play.
Perhaps the down bars are not as long, or the
stock stays in the upper half of the day's
trading range while the market or sector does
not. Or maybe the stock holds a support area
while the similar support area in the market or
sector does not hold. In extreme cases, the
stock may be basing at the high of the day or
making new highs while the market is pulling
back or making new lows.
Below is an example of a trade. It is a 5-minute
chart of Express Scripts Inc. (ESRX). The
relative strength became obvious between 9:50
and 11:00 A.M. EST. The red line is the 20
period moving average and the black line on the
NASDAQ is the 200 period moving average.
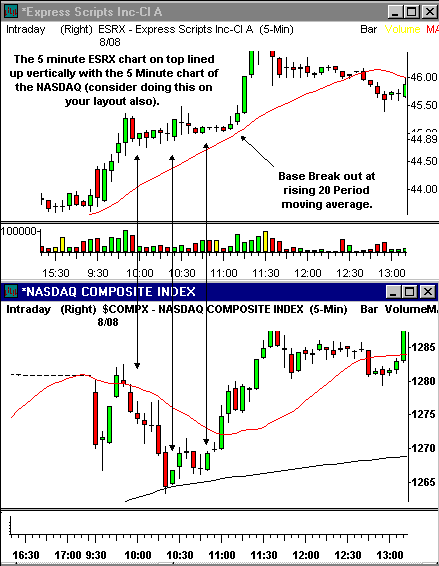
chart courtesy of
Mastertrader.com
Notice where the arrows
begin. The NASDAQ begins pulling back after a
marginal new high, but ESRX pulls back only
slightly from a substantial new high. It should
be noted that 9:50 is also the beginning of a
reversal time. Over the next half hour the
NASDAQ makes a new daily low, but ESRX refused
to move below the bottom of the last green bar
of the rally, and bases in a very tight base at
the high of the day.
By the time the next reversal time comes along
(10:30) the NASDAQ has pulled back to a support
area and also finds the rising 200 period moving
average. We know that as this moving average is
rising, there must be at least a marginal
uptrend on the 5-minute chart. During this time,
ESRX is basing at the high of the day. At this
point the trade looks very compelling. We now
have the NASDAQ at support, at a reversal time,
while in an uptrend. We have ESRX basing just
under the high of the day.
At the time ESRX breaks the high of the day it
is not extended because it moves as the rising
20 period moving average raises up to meet the
price bars. In the morning, the rising 20 period
moving average is a good "timing indicator".
Strong stocks should stay above the 20 period
moving average on the 5-minute chart in the
morning. Notice that this stock breaks out as
the 20 is about to come in contact with the
price. |