|
Williams' %R

Description
The formula
used to calculate Williams' %R is
similar to the Stochastic Oscillator:
Williams'
%R is plotted on an upside down scale
with 0 at the top and 100 at the bottom.
To show the indicator in this upside
down fashion, MetaStock Pro places a
minus symbol before the %R values. You
should ignore the minus symbol.
Interpretation
The
analysis of Williams' %R is very similar
to that of the
Stochastic
Oscillator except that %R is upside
down and the Stochastic Oscillator has
internal smoothing.
Readings in
the range of 80 to 100% (remember to
ignore the minus symbol) indicate that
the market is oversold, while readings
in the 0 to 20% range suggest that the
market is overbought.
As with all
overbought/oversold indicators, it is
best to wait for the security's price to
change direction before placing your
trades. For example, if an
overbought/oversold indicator (such as
the Stochastic Oscillator or Williams'
%R) is showing an overbought condition,
it is wise to wait for the security's
price to turn down before selling the
security (the MACD is a good indicator
to monitor change in a security's
price). It is not unusual for
overbought/oversold indicators to remain
in an overbought/oversold condition for
a long time period as the security's
price continues to climb/fall. Selling
simply because the security appears
overbought may take you out of the
security long before its price shows
signs of deterioration.
An
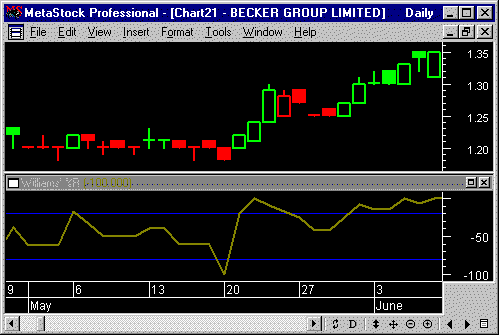
interesting phenomena of the %R
indicator is its uncanny ability to
anticipate a reversal in the underlying
security's price. The indicator almost
always forms a peak and turns down a few
days before the security's price peaks
and turns down. Likewise, %R usually
creates a trough and turns up a few days
before the security's price turns up. |